empty
 
 
19.11.2025 09:58 AM
AI bubble fears intensify

This time, everything is different. Investors have adapted to buy the dips, and the rapid rally in the S&P 500 from April to October proved the effectiveness of such a strategy. However, in November, the stock market began sending one alarming signal after another. The first drop of the broad index below the 50-day moving average since May was the first of these signals. Others followed soon after.

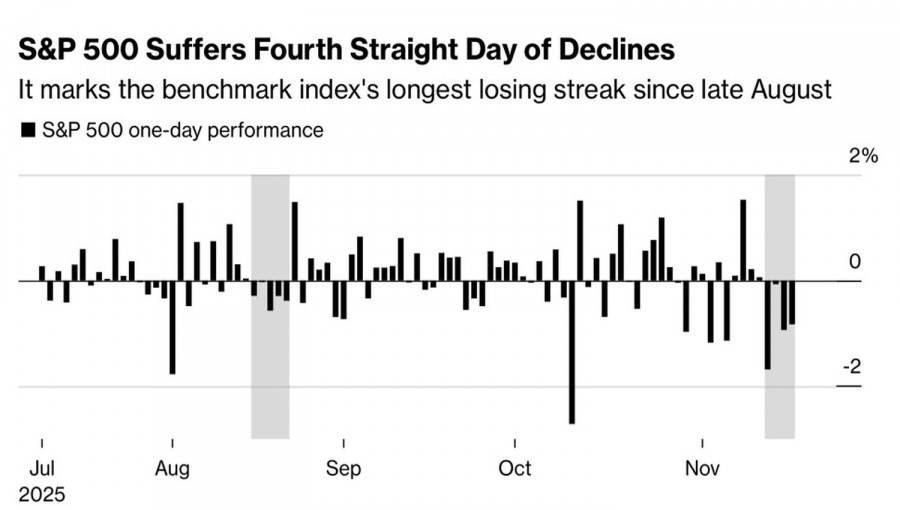
The Dow Jones has fallen by 4.5% over four trading sessions, marking the most serious sell-off from record highs since 1999. The Magnificent Seven stocks lost 5% of their value in November, with only Alphabet trading in the green. The S&P 500 has gone 14 days without a new record. While this might not seem significant by itself, it represents the longest losing streak in 88 sessions from February to June.

Daily S&P 500 dynamics

This image is no longer relevant

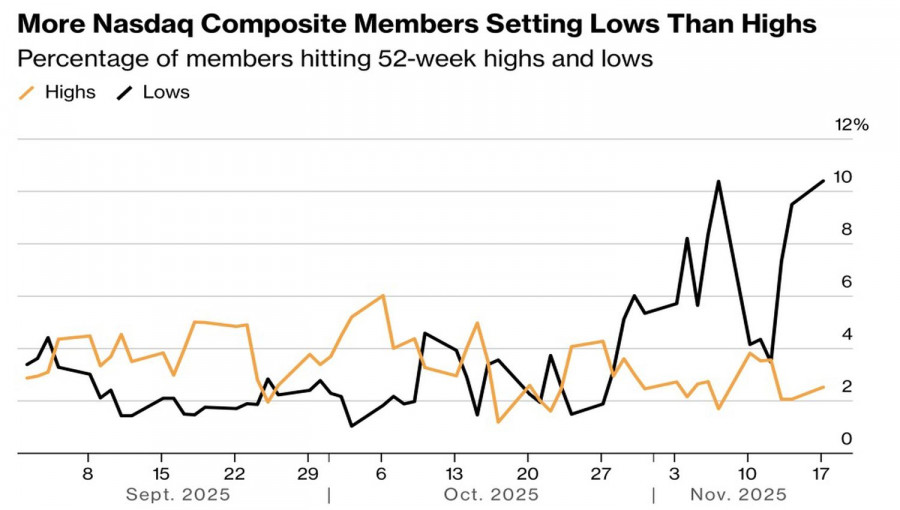
Since the beginning of the month, the S&P 500 has dropped by 3%. If this trend continues until the end of the month, November will become the worst month since 2008. The VIX fear index has surpassed the critical mark of 20 and reached 24, the highest level since mid-October. 22V Research notes that the share of companies in the Nasdaq Composite whose stocks have reached a 52-week low exceeds the share of those at 52-week highs. When the market registers more lows than highs, it indicates a bearish orientation.

Is the current decline of the S&P 500 a healthy correction or a reversal of the upward trend? It depends on what underlies the pullback. According to 45% of institutional investors surveyed by Bank of America, the main risk for the US stock market is an artificial intelligence bubble. This figure significantly exceeds the 11% noted in September.

Dynamics of Nasdaq Composite stocks at extreme positions

This image is no longer relevant

Among other tail risks, investors pointed to rising Treasury yield and inflation. The former was the main concern in September, and it is materializing. The Fed is not in a hurry to cut the federal funds rate in December. Hopes for monetary stimulus had been a lifeline for the S&P 500, allowing the market to overlook the inflated fundamental valuations of tech giants and their modest profits compared to investments.

This image is no longer relevant

Now, the time for reckoning has arrived. The lack of transparency due to insufficient official data, as well as the upcoming challenges of corporate earnings from NVIDIA, the minutes from the October FOMC meeting, and September's employment statistics are causing investors to step back. The closing of positions has led to a pullback in the broad index.

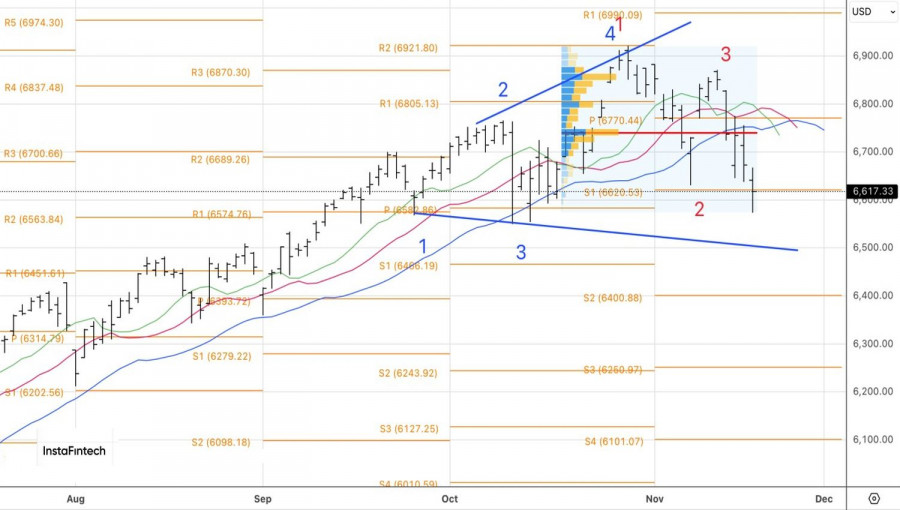
Technically, on the daily chart of the S&P 500, the market is playing out a reversal pattern of 1-2-3 and is ready to activate the Expanding Wedge model. For this to happen, quotes will need to drop below 6,550. As long as trading remains below 6,700, it makes sense to maintain a focus on selling.

Marek Petkovich,
Analytical expert of InstaForex
© 2007-2025
Summary
Urgency
Analytic
Igor Kovalyov
Start trade
Earn on cryptocurrency rate changes with InstaForex
Download MetaTrader 4 and open your first trade
  • Grand Choice
    Contest by
    InstaForex
    InstaForex always strives to help you
    fulfill your biggest dreams.
    JOIN CONTEST
  • Chancy Deposit
    Deposit your account with $3,000 and get $5000 more!
    In November we raffle $5000 within the Chancy Deposit campaign!
    Get a chance to win by depositing $3,000 to a trading account. Having fulfilled this condition, you become a campaign participant.
    JOIN CONTEST
  • Trade Wise, Win Device
    Top up your account with at least $500, sign up for the contest, and get a chance to win mobile devices.
    JOIN CONTEST
  • 30% Bonus
    Receive a 30% bonus every time you top up your account
    GET BONUS

Recommended Stories

Can't speak right now?
Ask your question in the chat.
Widget callback