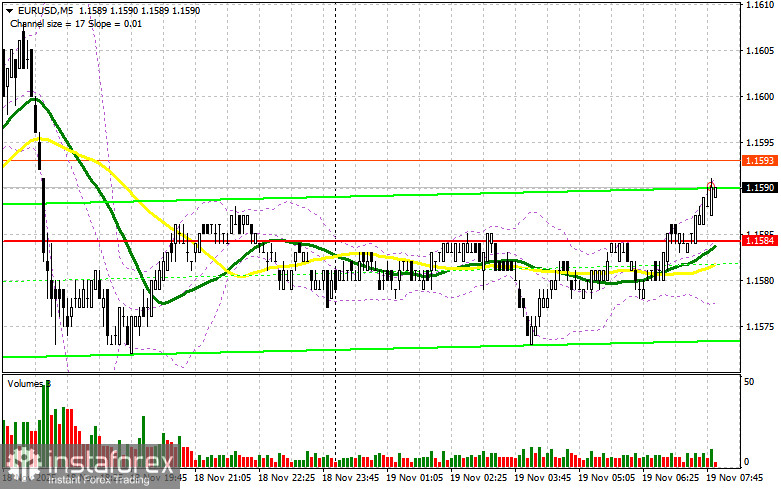
Yesterday, there were no suitable entry points in the market. Let's take a look at the 5-minute chart and analyze what happened. In my morning forecast, I highlighted the level of 1.1584 and planned to make market entry decisions based on it. A decline occurred, but the situation did not reach the test of 1.1584, so I was left without trades in the first half of the day. The same story repeated itself in the second half of the day.
For opening long positions on EUR/USD, it is required:
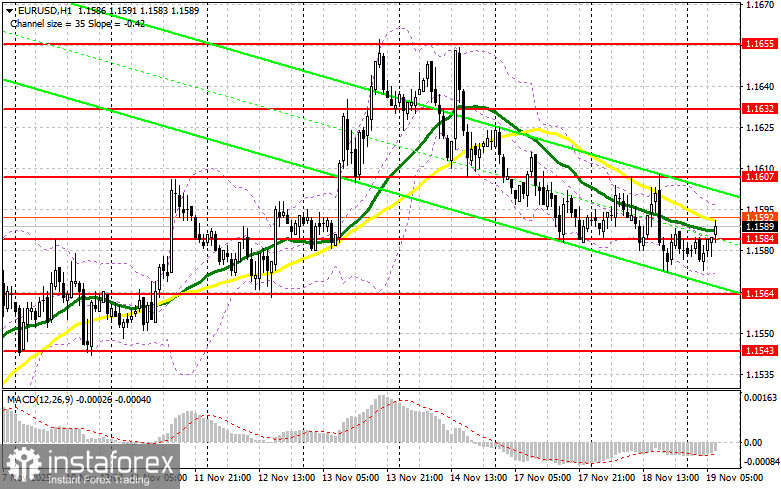
Good data on manufacturing orders in the U.S. and cautious statements from Federal Reserve representatives supported the dollar in the second half of the day, but this did not lead to strong technical changes in the market. Today, pressure on the euro may increase. In the first half of the day, data on the Eurozone Consumer Price Index and the core Consumer Price Index for October this year are expected. A report on the European Central Bank's current account balance will also be published. If the figures turn out to be lower than economists' forecasts, it will boost the confidence of the ECB in its actions regarding interest rates, which will weaken the euro's position. In this case, I expect the first signs of buyers only around the support level of 1.1584, which is of an intermediate nature. The formation of a false breakout there will provide an entry point for long positions, with the aim of further recovery of the pair to resistance at 1.1607. A breakout and a reverse test of this range will confirm the right actions for buying the euro in anticipation of a larger jump of the pair to 1.1632. The furthest target will be last week's high at 1.1655, where I will take profit. Testing this level will strengthen the bullish market for the euro. In the event of a decline in EUR/USD and a lack of activity around 1.1584, pressure on the pair will intensify, potentially leading to a larger sell-off. Sellers will likely reach the next interesting level at 1.1564. Only the formation of a false breakout there will be an appropriate condition for buying the euro. Long positions will be opened at a rebound from 1.1543 with the aim of an upward correction of 30-35 pips within the day.
For opening short positions on EUR/USD, it is required:
Sellers continue the correction, but they do it quite cautiously. In the event of a rise in the euro and a bullish reaction to Eurozone inflation data, the initial task for bears will be to defend the 1.1607 resistance level. The formation of a false breakout there will provide an entry point for short positions, aiming to move the pair to support at 1.1584. A breakout and consolidation below this range, along with a reverse test from bottom to top, will be another suitable option for opening short positions with a move toward 1.1564. The furthest target will be the 1.1543 area, where I will take profit. In the case of an upward move in EUR/USD and the absence of active bearish action around 1.1607, it is best to postpone short positions until a larger level at 1.1632. Selling there will only be done after an unsuccessful consolidation. I plan to open short positions on a rebound from 1.1655, aiming for a 30-35-pip downward correction.
Recommended for review:
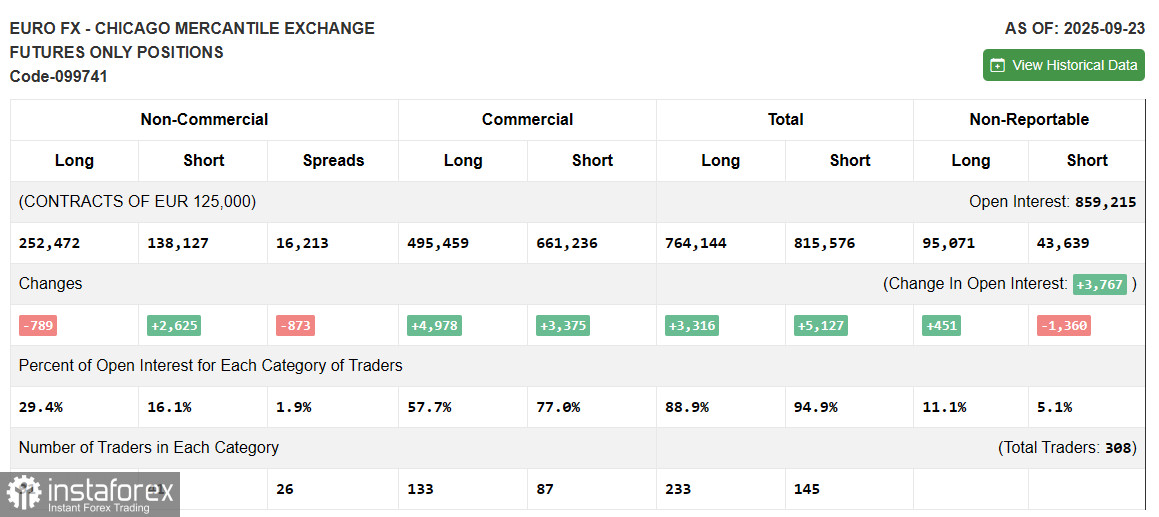
Due to the U.S. government shutdown, fresh Commitment of Traders data is not being published. The last relevant report is only from September 23.
In the COT report (Commitment of Traders) for September 23, there was an increase in short positions and a reduction in long positions. Expectations of further declines in interest rates by the Federal Reserve continue to exert pressure on the U.S. dollar. However, the number of euro buyers is not increasing either, as political problems in France and risks of a new wave of inflation growth force the ECB to act much more cautiously, slowing economic growth. The COT report indicates that non-commercial long positions decreased by 789 to a level of 252,472, while non-commercial short positions increased by 2,625 to a level of 138,625. As a result, the spread between long and short positions decreased by 873.
Indicator Signals:
Moving Averages
Trading is conducted below the 30 and 50-day moving averages, indicating a further correction of the pair.
Note: The period and prices of moving averages are considered by the author on the hourly chart H1 and differ from the general definition of classical daily moving averages on the daily chart D1.
Bollinger Bands
In the case of a decline, the lower boundary of the indicator around 1.1570 will serve as support.
Description of Indicators:
- Moving Average (MA): Determines the current trend by smoothing out volatility and noise. Period – 50. Highlighted in yellow on the chart.
- Moving Average (MA): Determines the current trend by smoothing out volatility and noise. Period – 30. Highlighted in green on the chart.
- MACD Indicator (Moving Average Convergence/Divergence): Fast EMA – period 12. Slow EMA – period 26. SMA – period 9.
- Bollinger Bands: Period – 20.
- Non-commercial Traders: Speculators such as individual traders, hedge funds, and large institutions that use the futures market for speculative purposes, meeting certain requirements.
- Long Non-commercial Positions: The total long open position of non-commercial traders.
- Short Non-commercial Positions: The total short open position of non-commercial traders.
- Total Non-commercial Net Position: The difference between the short and long positions of non-commercial traders.