EUR/USD 5-Minute Analysis
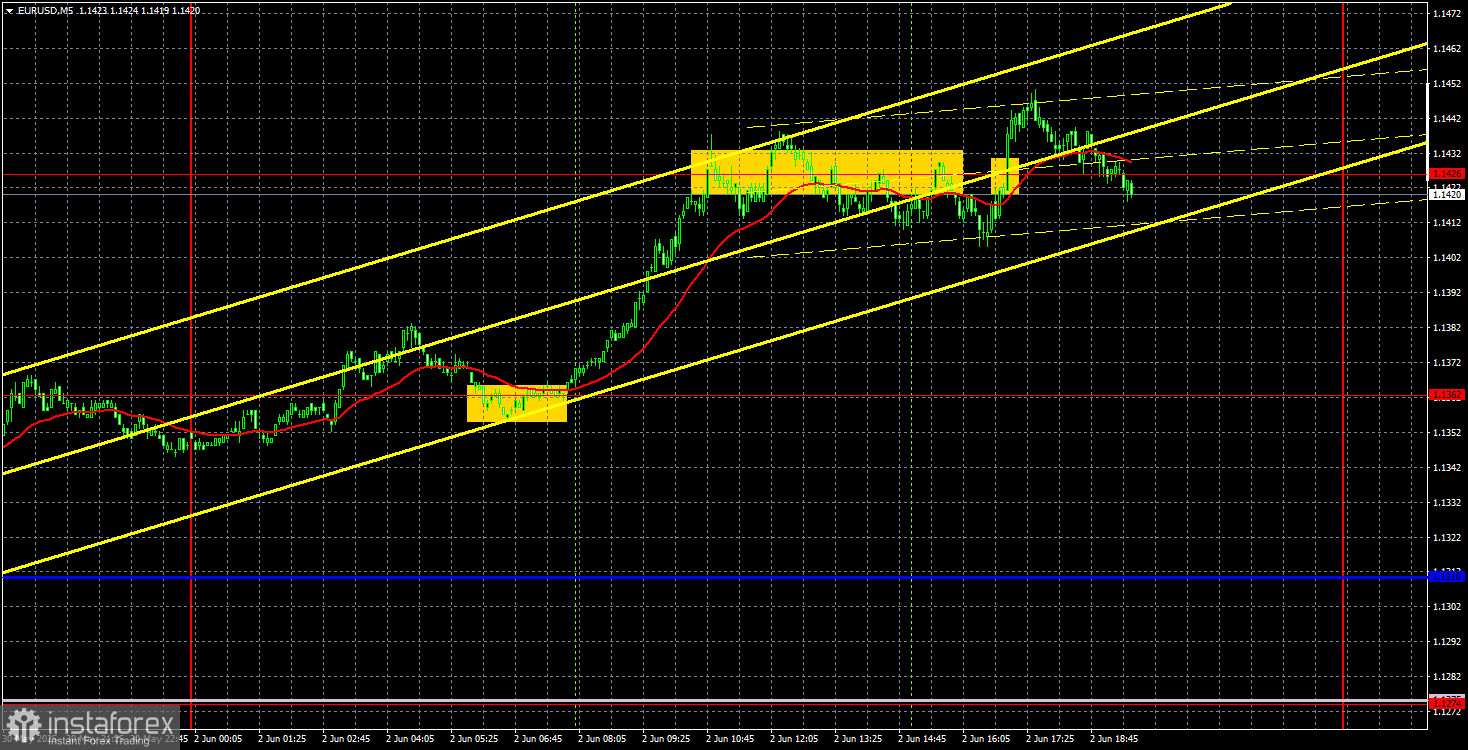
The EUR/USD currency pair showed fairly strong upward movement on Monday. Just as expected, the U.S. dollar started falling right from the market's opening on Monday night. What else could have been anticipated after Trump announced over the weekend that he intended to raise tariffs on steel and aluminum by another 25%? This was a new round of escalation in the trade war, and traders reacted accordingly. During the U.S. session, the most important report of the day was also published — the U.S. Manufacturing PMI. Its value in May was 48.5, compared to a forecast of 49.5. Thus, even if traders had intended to leave the dollar alone by the U.S. session, the macroeconomic backdrop didn't allow it.
Despite breaking through the ascending trendline, the upward trend resumed, as we had warned. With all due respect to the American currency, it is extremely difficult to expect strong dollar growth with Trump around. Even if a rally begins, it is uncertain when Trump will next appear on stage to announce any new tariffs, sanctions, or restrictions. Thus, the technical background is being overwhelmed by fundamentals.
On the 5-minute timeframe, a decent buy signal was formed early in the morning around the 1.1362 level. A few hours later, the price reached the 1.1426 level, where the upward movement halted. After that, the pair mostly traded sideways, but the overnight and morning movements were more than enough for a new dollar sell-off and to allow traders to profit. Technically, a rebound from 1.1426 could also have been traded, but this trade closed with a minimal loss.
COT Report
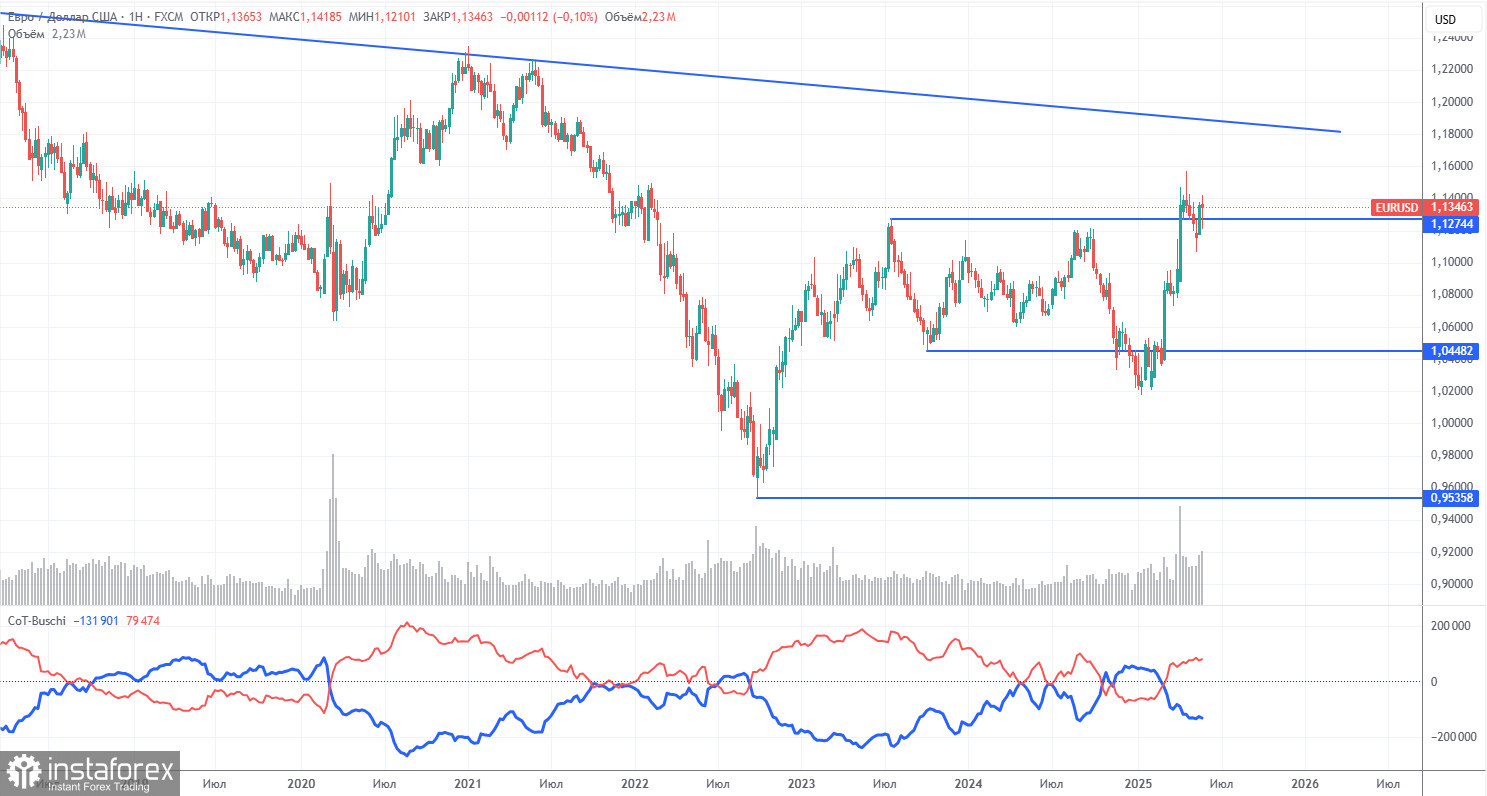
The latest COT report is dated May 27. The chart above shows that the net position of non-commercial traders was bullish for a long time; bears barely gained the upper hand at the end of 2024 but quickly lost it. Since Trump took office as U.S. president, the dollar has rapidly declined in value. We cannot be 100% certain that the dollar's decline will continue, but current global developments point precisely in that direction.
We still do not see any fundamental factors supporting the euro, but one decisive factor remains for the dollar's decline — Trump's trade wars. The global downtrend persists, but what value does a trend have now? The dollar might recover once Trump ends his trade wars — but will he end them? And when?
The red and blue lines have crossed again, so the market trend is again "bullish." Over the last reporting week, the number of long positions in the "Non-commercial" group decreased by 1,700, while shorts decreased by 6,700. Thus, the net position fell by 5,000 over the week. However, COT reports come with a one-week delay. At the moment, the market is actively buying EUR/USD again.
EUR/USD 1-Hour Analysis
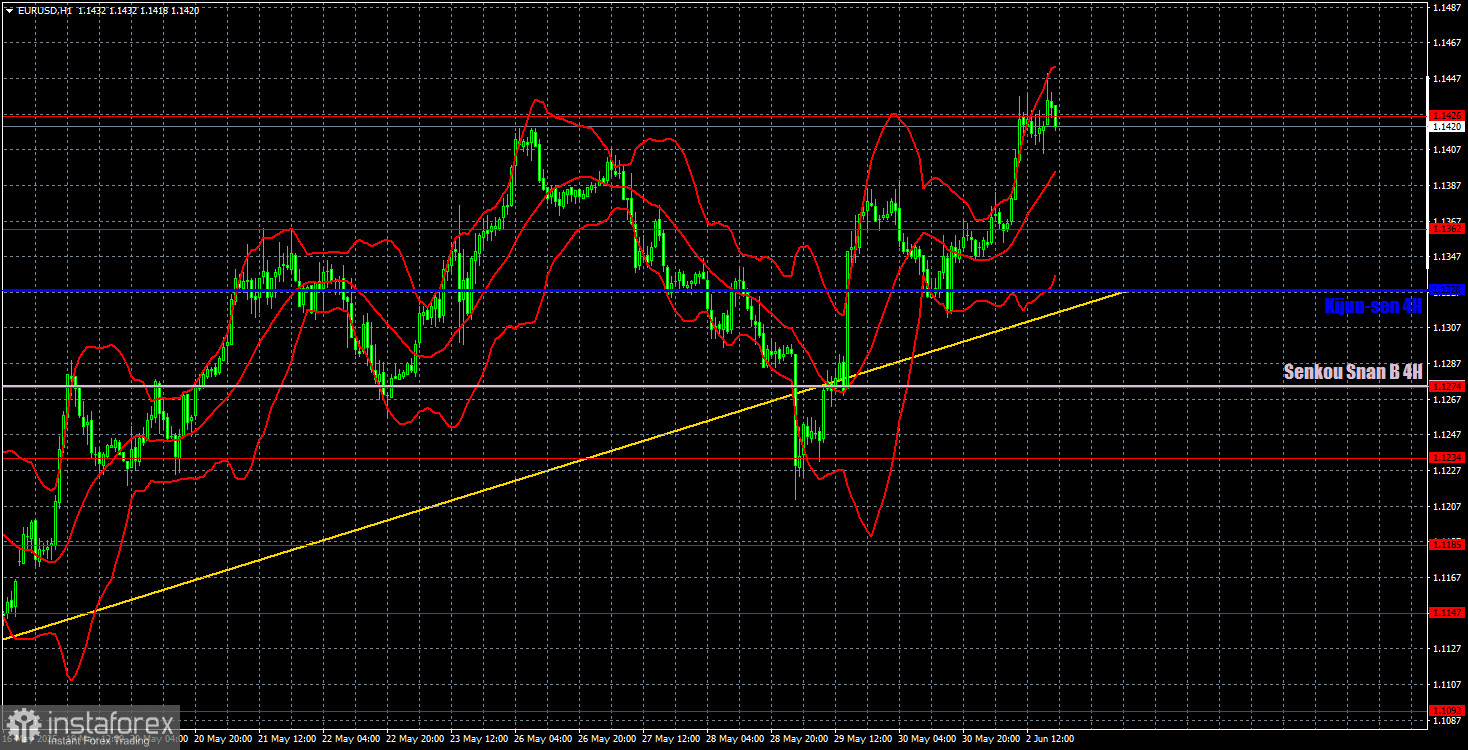
On the hourly timeframe, the EUR/USD pair maintains a local uptrend, part of a 4-month trend. The prospects for the U.S. dollar still depend on developments related to the global trade war. If trade agreements are signed and tariffs reduced, the U.S. dollar could begin to recover. However, currently, no trade deals are in place, and Trump continues to make strange decisions and statements that shock market participants. The market expects the worst, and Trump consistently confirms that pessimism.
For June 3, we highlight the following trading levels — 1.0823, 1.0886, 1.0949, 1.1006, 1.1092, 1.1147, 1.1185, 1.1234, 1.1274, 1.1362, 1.1426, 1.1534, 1.1607 — as well as the Senkou Span B (1.1275) and Kijun-sen (1.1328) lines. The Ichimoku indicator lines can move during the day, which should be considered when determining trading signals. Remember to set a Stop Loss to break even if the price moves 15 pips in the right direction. This will protect against potential losses if the signal turns out to be false.
Inflation data for May are scheduled to be released in the Eurozone on Tuesday. This data could be interesting but is unlikely to significantly influence market sentiment or the European Central Bank's decision on Thursday. In the U.S., the JOLTs job openings report for April will be published, but it is not a significant report.
Illustration Explanations:
- Support and resistance price levels – thick red lines where movement may end. They are not trading signal sources.
- Kijun-sen and Senkou Span B lines—These are strong Ichimoku indicator lines transferred to the hourly timeframe from the 4-hour one.
- Extremum levels – thin red lines where the price has previously rebounded. These act as trading signal sources.
- Yellow lines – trend lines, trend channels, and other technical patterns.
- COT Indicator 1 on the charts – the size of the net position for each category of traders.