Analysis of Friday's Trades
1H Chart of EUR/USD
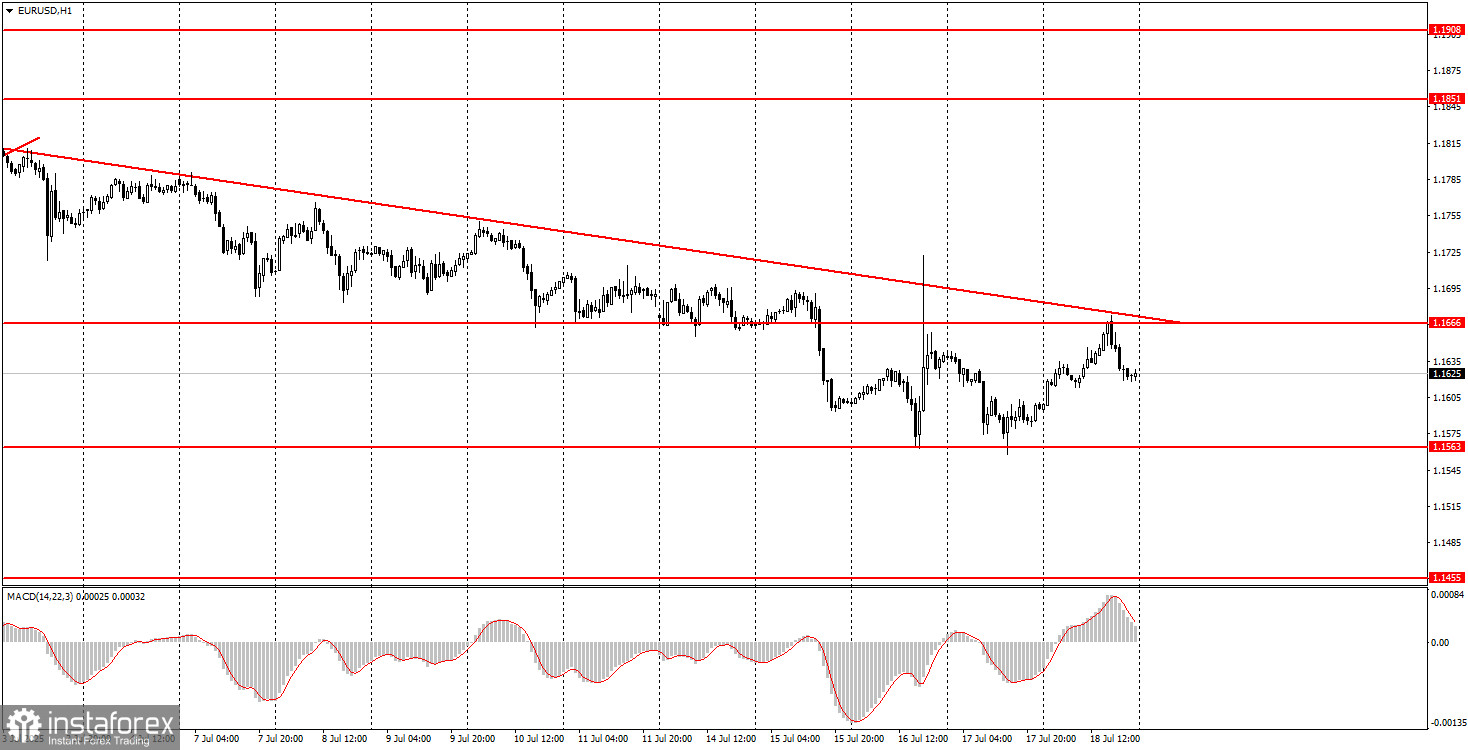
On Friday, the EUR/USD currency pair continued its upward movement after rebounding twice from the 1.1563 level. By the end of the day, it reached the notable 1.1666 level as well as the descending trendline. Traders were unable to break through either of these barriers before the end of the trading week.
Among Friday's key events, we can highlight only the University of Michigan Consumer Sentiment Index, which came in at 61.8 in July, slightly above the forecast. Around the same time, the U.S. dollar began to strengthen, but we believe the descending trendline and the strong 1.1666 level played a more significant role in supporting the dollar.
As a result, the downward trend remains in effect, and a return to the 1.1563 level can be expected at the very least in the new week. The U.S. dollar continues to rise solely on bearish enthusiasm, as the fundamental backdrop remains unfavorable for it. A price consolidation above the descending trendline would signal the end of the dollar's three-week rise.
5M Chart of EUR/USD
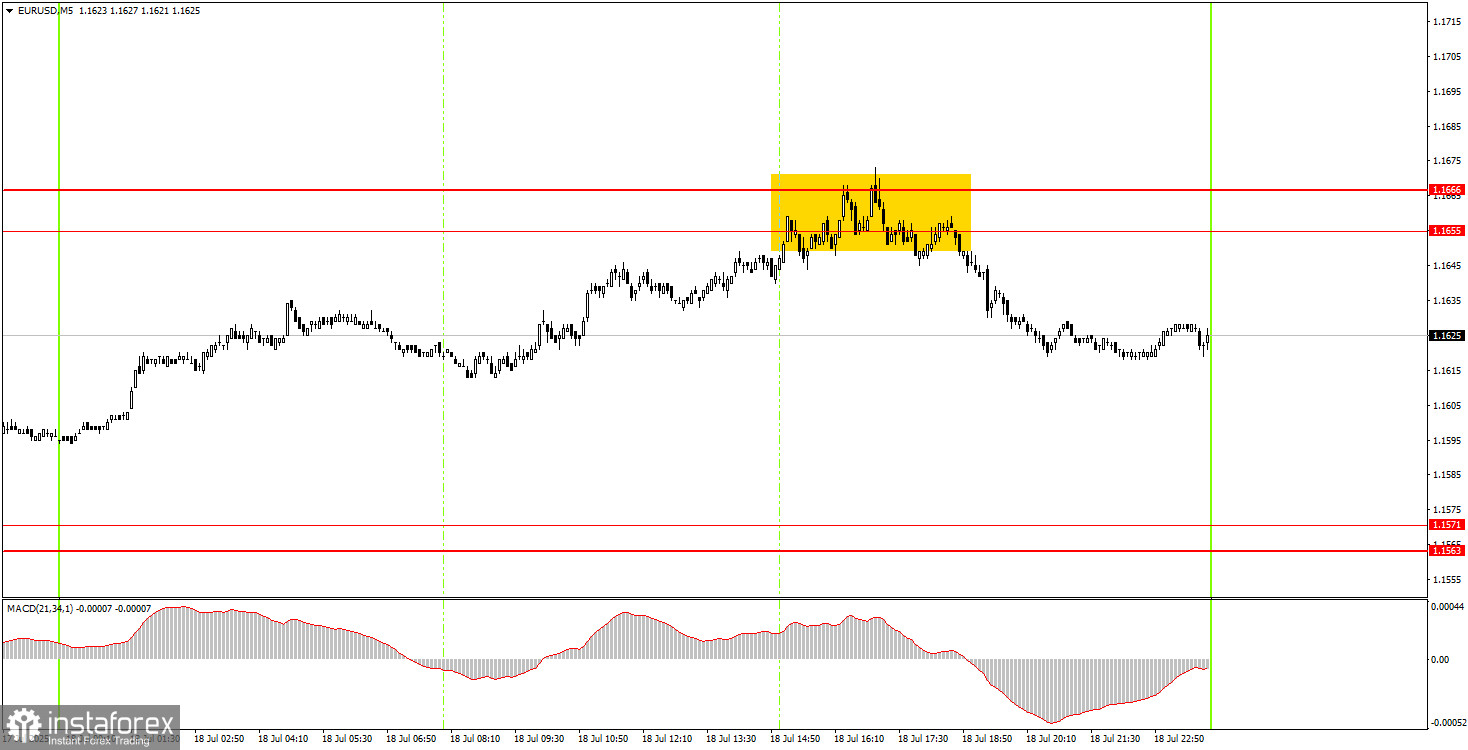
On the 5-minute timeframe, only one trading signal was formed on Friday. During the U.S. trading session, the euro tested the 1.1655–1.1666 area and rebounded sharply. This generated a sell signal, after which the pair fell by 20–25 pips. This trading signal could have been skipped, as it appeared just a few hours before the market closed. However, if novice traders decided to act on it, they would have made a small profit.
Trading Strategy for Monday:
On the hourly timeframe, the EUR/USD pair is still undergoing a correction; however, this does not impact the broader six-month uptrend. We do not believe that the dollar's long-term decline has come to an end. The U.S. dollar has been in decline for six months and has only begun to correct for a few weeks. Donald Trump's policies remain unchanged, so expecting a medium-term rise in the dollar is not yet justified.
On Monday, the EUR/USD pair may resume its move toward the 1.1563 level, as it failed to break through either the trendline or the 1.1666 resistance. However, we believe a new attempt to complete the current downtrend is more likely, especially considering the current fundamental backdrop raises serious doubts about sustained dollar strength.
On the 5-minute timeframe, the following levels should be considered: 1.1198–1.1218, 1.1267–1.1292, 1.1354–1.1363, 1.1413, 1.1455–1.1474, 1.1527, 1.1563–1.1571, 1.1655–1.1666, 1.1740–1.1745, 1.1808, 1.1851, 1.1908.
No significant events or reports are scheduled for Monday in either the Eurozone or the United States. Unless Trump sparks another "storm" in the markets, we expect calm price action and low volatility throughout the day.
Core Trading System Rules:
- Signal Strength: The shorter the time it takes for a signal to form (a rebound or breakout), the stronger the signal.
- False Signals: If two or more trades near a level result in false signals, subsequent signals from that level should be ignored.
- Flat Markets: In flat conditions, pairs may generate many false signals or none at all. It's better to stop trading at the first signs of a flat market.
- Trading Hours: Open trades between the start of the European session and the middle of the US session, then manually close all trades.
- MACD Signals: On the hourly timeframe, trade MACD signals only during periods of good volatility and a clear trend confirmed by trendlines or trend channels.
- Close Levels: If two levels are too close (5–20 pips apart), treat them as a support or resistance zone.
- Stop Loss: Set a Stop Loss to breakeven after the price moves 15 pips in the desired direction.
Key Chart Elements:
Support and Resistance Levels: These are target levels for opening or closing positions and can also serve as points for placing Take Profit orders.
Red Lines: Channels or trendlines indicating the current trend and the preferred direction for trading.
MACD Indicator (14,22,3): A histogram and signal line used as a supplementary source of trading signals.
Important Events and Reports: Found in the economic calendar, these can heavily influence price movements. Exercise caution or exit the market during their release to avoid sharp reversals.
Forex trading beginners should remember that not every trade will be profitable. Developing a clear strategy and practicing proper money management are essential for long-term trading success.