Analysis of Tuesday's Trades:
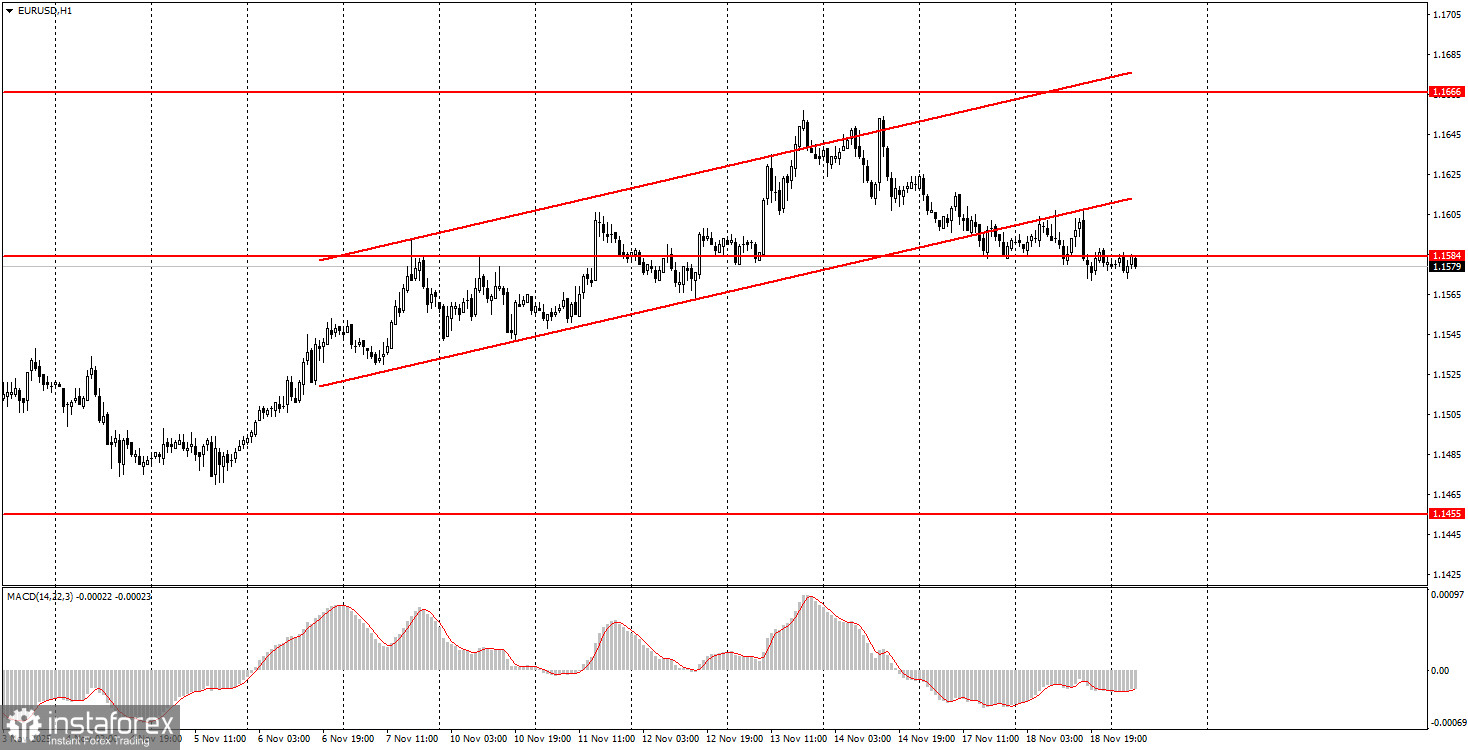
1H Chart of the EUR/USD Pair
The EUR/USD currency pair felt like it was at a wake throughout Tuesday. The overall volatility of the day was even lower than 40 pips, with no important macroeconomic reports or fundamental events. Therefore, there is essentially nothing to analyze from the previous day. We can only hope that at least tomorrow the market will wake up and begin to move in the short term. It is worth noting that the daily timeframe remains flat, and whether anyone likes it or not, this flat has led to no market movement for over a month. Even on the 5-minute timeframe, movements are practically nonexistent. Furthermore, it is far from certain that we will see the start of a new trending movement on Thursday. Recall that in the past, nearly two months, there have been plenty of significant events, but most were ignored, and fewer of them provoked illogical market reactions. For instance, the market ignored the existence of a "shutdown" in the U.S. for a month and a half.
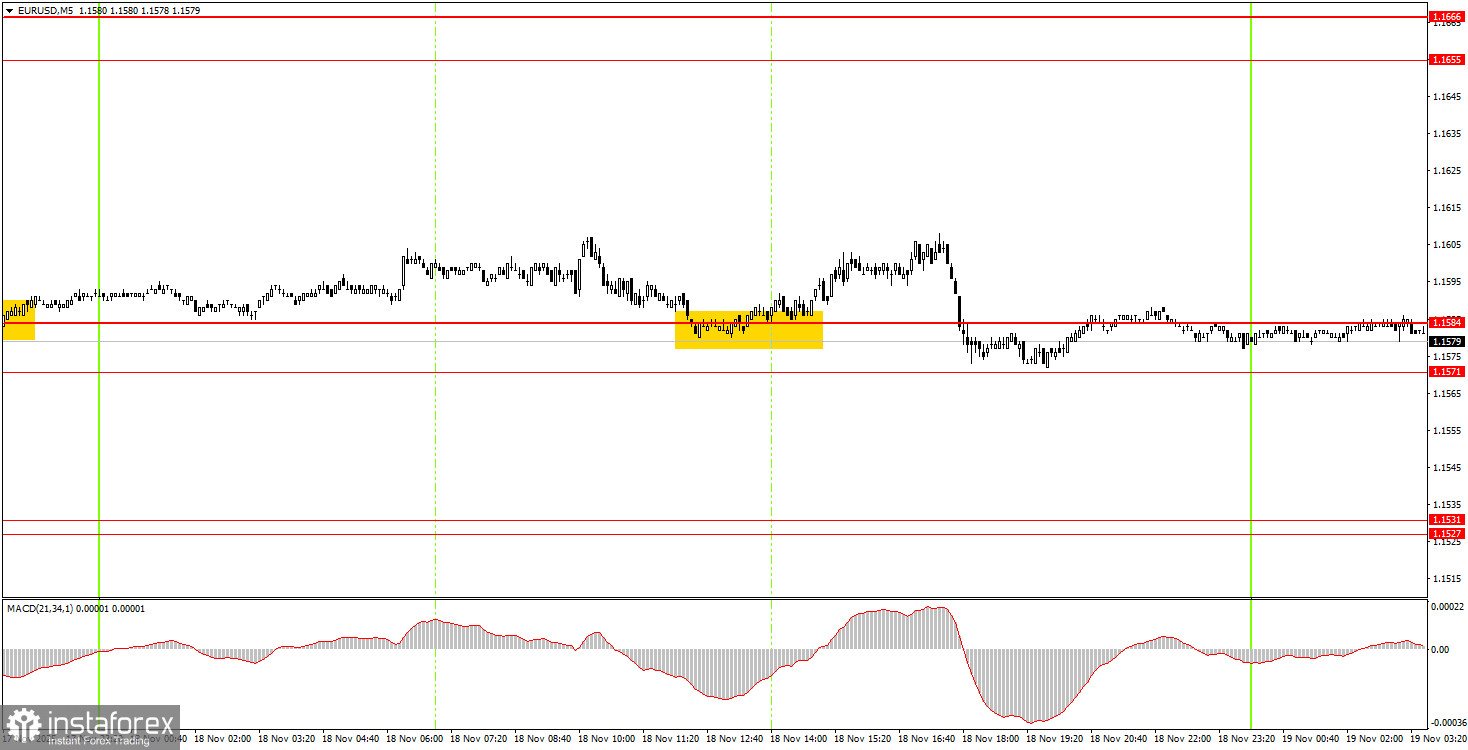
5M Chart of the EUR/USD Pair
On the 5-minute timeframe, one trading signal was formed on Tuesday. At the start of the American trading session, the price reached 1.1584 and bounced off it. The overall price increase was about 15-20 pips, and that's how much beginners could earn from this trade. Today, the pair could very well bounce off this level again or even the area of 1.1571-1.1584 to move up another 20-30 pips.
How to Trade on Wednesday:
On the hourly timeframe, the EUR/USD pair continues to form a new local upward trend with the potential for growth of another 150-200 pips. The overall fundamental and macroeconomic backdrop for the U.S. dollar remains very weak. Thus, the European currency may show a decline only on technical grounds—the flat on the daily timeframe remains relevant. However, we expect its completion and a resumption of the upward trend for 2025, and ascending movements can also occur within the flat.
On Wednesday, novice traders may trade from the area of 1.1571-1.1584. Another bounce from this area will allow for opening long positions targeting 1.1655. A price consolidation below the area of 1.1571-1.1584 will make short positions relevant with a target of 1.1534.
On the 5-minute timeframe, the following levels should be considered: 1.1354-1.1363, 1.1413, 1.1455-1.1474, 1.1527-1.1531, 1.1571-1.1584, 1.1655-1.1666, 1.1745-1.1754, 1.1808, 1.1851, 1.1908, 1.1970-1.1988. On Wednesday, the second estimate of the inflation report is scheduled for release in Europe, which holds low significance. In the U.S., the minutes from the last FOMC meeting will be published, but they don't carry much value for traders.
Key Principles of My Trading System:
- The strength of the signal is considered based on the time taken to form the signal (bounce or breach of a level). The less time taken, the stronger the signal.
- If two or more trades have been opened around a certain level based on false signals, all subsequent signals from that level should be ignored.
- In a flat market, any pair can create numerous false signals or may not form them at all. In any case, it's best to stop trading at the first signs of a flat.
- Trading deals are opened during the period between the start of the European session and the middle of the American session, after which all deals should be closed manually.
- On the hourly timeframe, it is preferable to trade based on signals from the MACD indicator only when there is good volatility and a trend that is confirmed by a trend line or trend channel.
- If two levels are too close to each other (between 5 and 20 pips), they should be treated as an area of support or resistance.
- After a 15-pip move in the right direction, a Stop Loss should be set to breakeven.
What the Charts Show:
- Support and resistance price levels are targets for opening buy or sell positions. Take Profit levels can be placed around them.
- Red lines indicate trend channels or trend lines, reflecting the current trend and indicating the preferred trading direction.
- The MACD indicator (14,22,3) — histogram and signal line — is a supplementary indicator that can also be used as a source of signals.
Important announcements and reports (always available in the news calendar) can significantly impact the movement of the currency pair. Therefore, during their release, it is recommended to trade with maximum caution or to exit the market to avoid sharp reversals against the preceding movement.
Beginners trading on the Forex market should remember that not every trade can be profitable. Developing a clear strategy and money management is key to long-term success in trading.