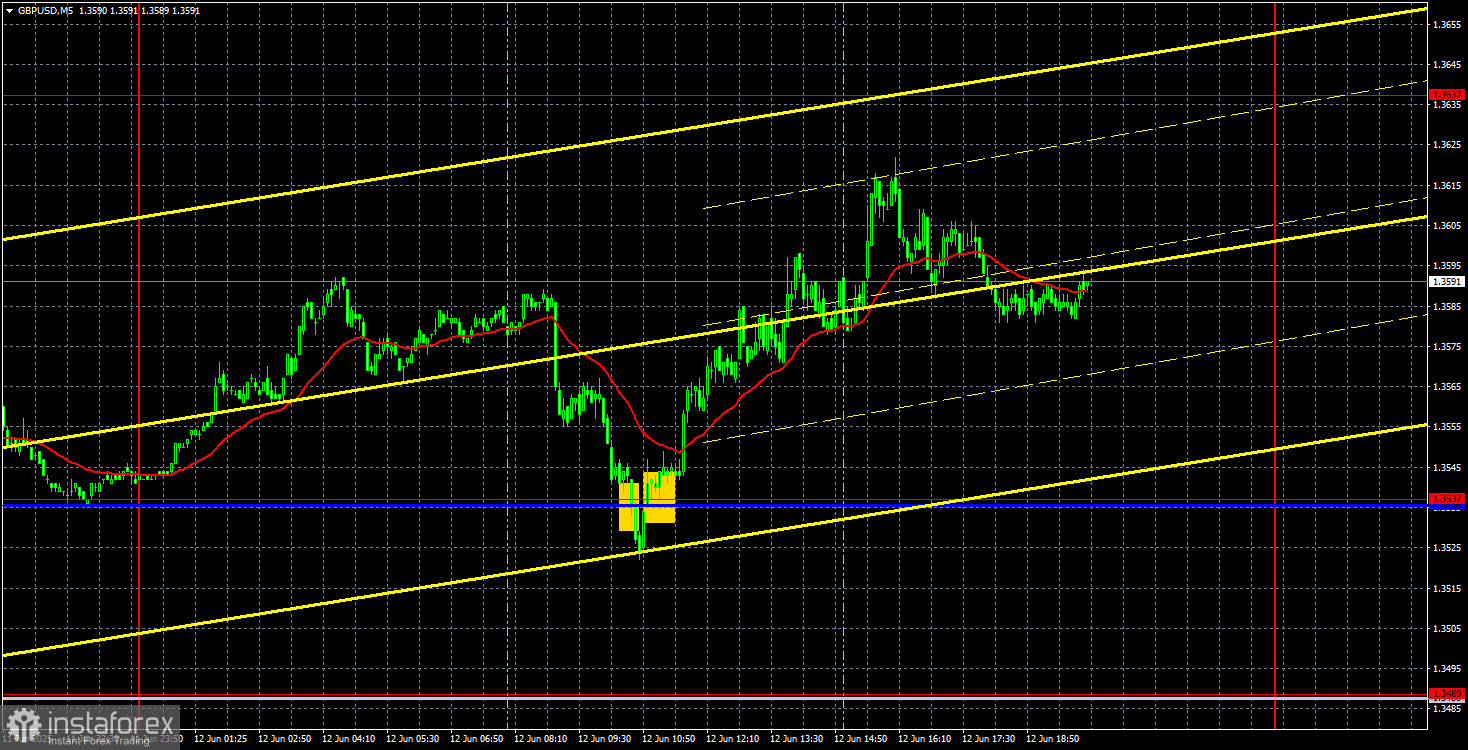
GBP/USD 5-Minute Analysis
On Thursday, the GBP/USD currency pair continued to move upward. However, somewhat surprisingly, the pound appreciated less this week than the euro. The British currency came under pressure first from unemployment reports and then from GDP and industrial production data. Although we previously noted that these reports were not highly important, the market responded actively. Most importantly, the reports pointed to a decline in the pound, and—miraculously!—the market finally reacted to the reports in favor of the U.S. dollar. Still, the dollar was unable to reap much benefit from this. The pound dropped only slightly and briefly—just twice. All other times, it was climbing. As a result, it has grown less than the euro and has not yet updated its three-year highs.
However, given that Donald Trump's policies and approach to governance remain unchanged over time, we can assume that the dollar's decline will continue. If Trump talks about raising tariffs again today or provides any clarifications (such as setting deadlines and terms for the hikes), this could trigger a new wave of dollar weakening. For now, the pound is trading more sideways than upward. The key takeaway is that it still refuses to fall.
Only two trading signals were generated on Thursday's 5-minute timeframe. Both were near the Kijun-sen line and the 1.3537 level, forming a strong support area. Unfortunately, due to UK news, the price managed to pierce through this area, triggering a sell signal. Selling the pound after a 60-pip drop in the morning was probably not ideal, but traders could have entered that position. Later, a valid buy signal appeared, and the price increased by 40–70 pips by the end of the day.
COT Report
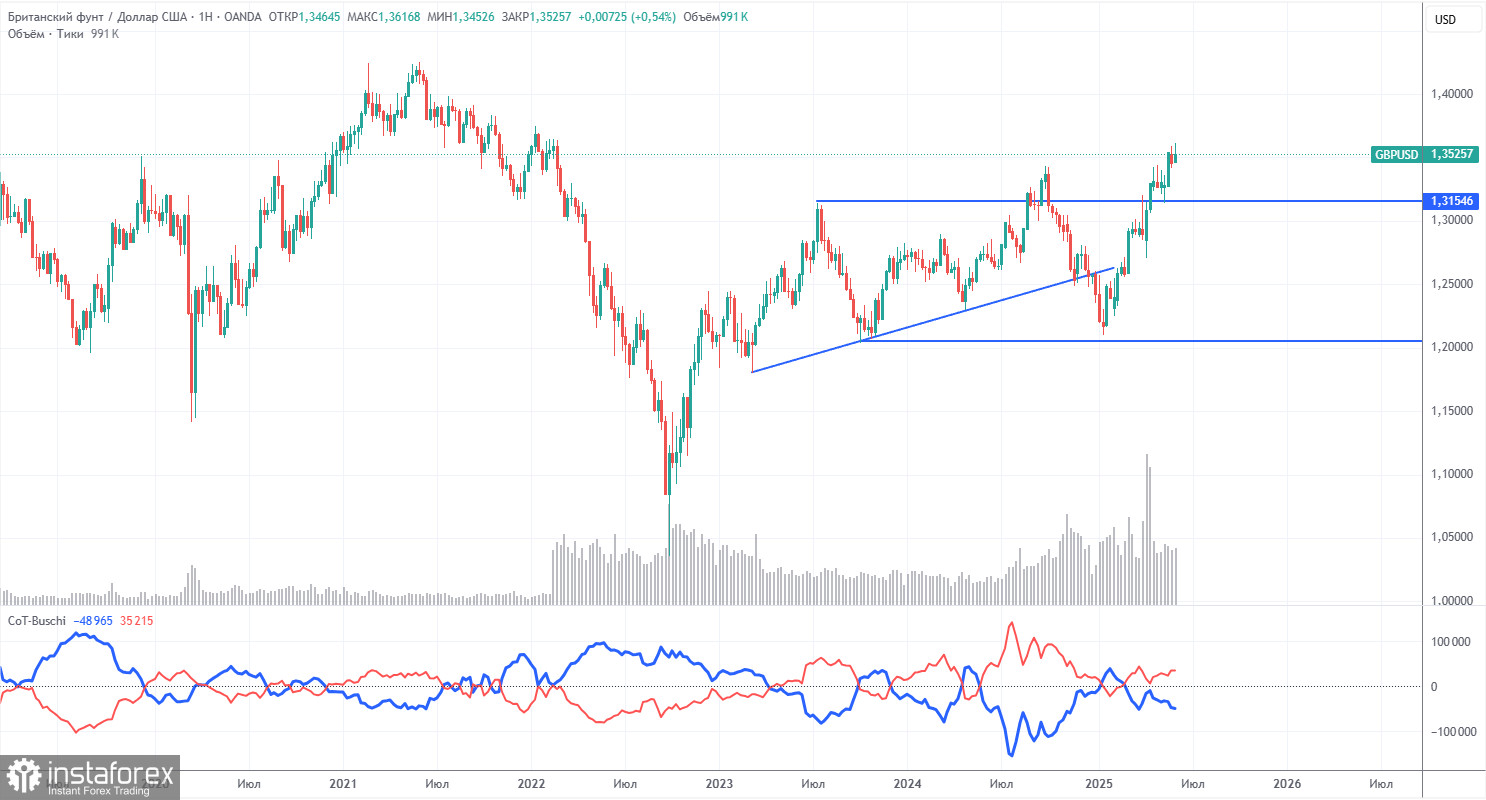
The COT reports for the British pound show that commercial traders' sentiment has constantly changed in recent years. The red and blue lines, representing the net positions of commercial and non-commercial traders, constantly cross and are usually near the zero mark. They are currently close to each other, indicating a roughly equal number of buy and sell positions. However, the net position has been increasing over the last year and a half.
The dollar continues to fall due to Donald Trump's policies, so market makers' demand for the pound sterling is not very important at the moment. If de-escalation of the global trade war resumes, the U.S. dollar will have a chance for some strengthening. According to the latest COT report on the pound, the "Non-commercial" group opened 1,300 BUY contracts and 1,400 SELL contracts. Thus, the net position of non-commercial traders barely changed for the reporting week.
Recently, the pound has risen significantly, but it's important to note that there's only one reason: Trump's policy. Once that factor is neutralized, the dollar could rise, but no one knows when that will happen. The pound itself has no fundamental reasons for growth. Nevertheless, traders are more than satisfied with the "Trump factor" when making trading decisions.
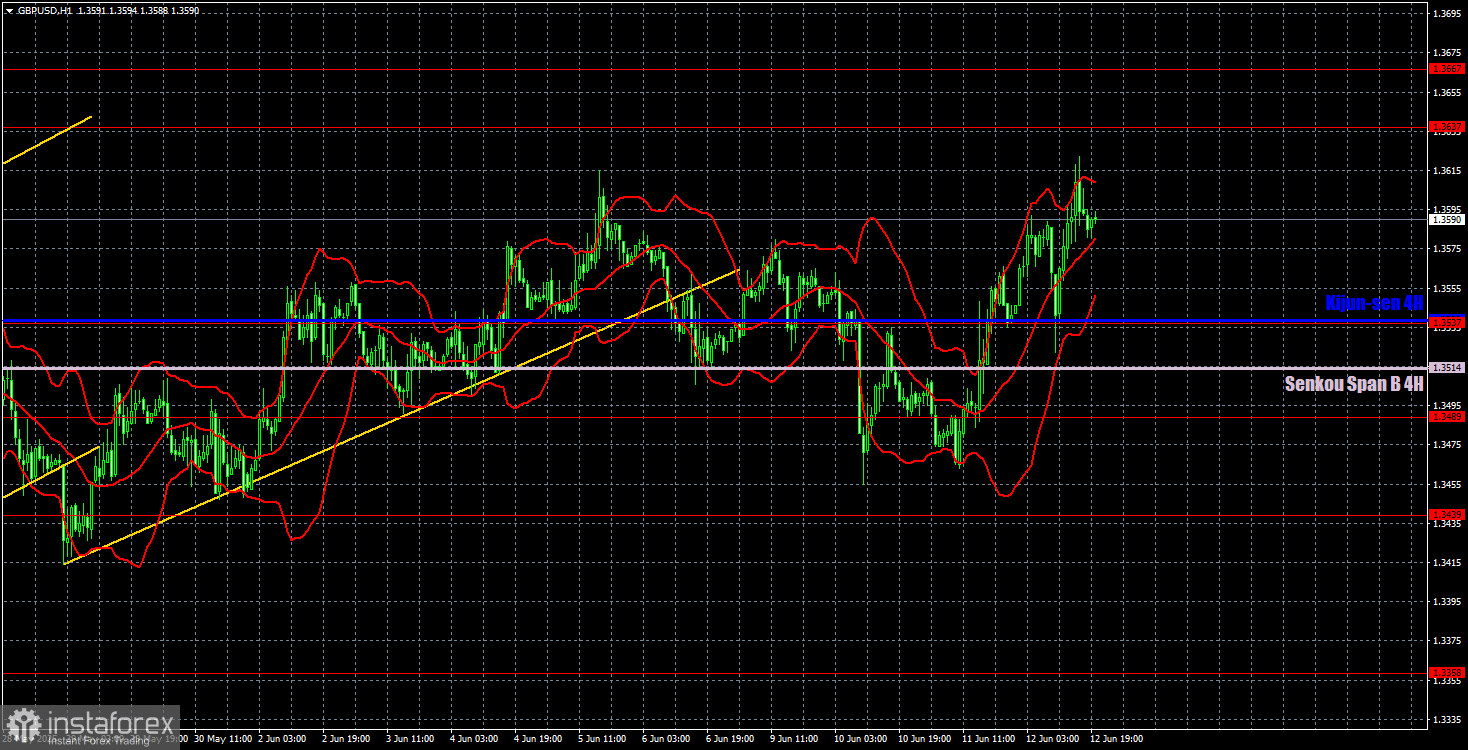
GBP/USD 1-Hour Analysis
In the hourly timeframe, the GBP/USD pair maintains a bullish trend despite consolidation below the ascending channel and upward trendline. The U.S. dollar has only made a minor correction, and the market is still focused on medium-term buying. On the 4-hour timeframe, a sideways range is clearly visible, where the price remains, while there is a strong bullish trend on the daily chart. Thus, there are no technical reasons for a sharp decline in the pair. However, the fundamental backdrop—especially Trump-related news—continues to exert pressure on the dollar.
For June 13, we highlight the following important levels for trading: 1.2981–1.2987, 1.3050, 1.3125, 1.3212, 1.3288, 1.3358, 1.3439, 1.3489, 1.3537, 1.3637–1.3667, 1.3741. The Senkou Span B line (1.3514) and the Kijun-sen line (1.3539) can also serve as signal points. A Stop Loss level is recommended to be set to breakeven once the price moves 20 pips in the right direction. Ichimoku indicator lines may shift throughout the day, which must be considered when identifying trade signals.
No significant events or reports are scheduled in the UK on Friday. In the U.S., only the University of Michigan Consumer Sentiment Index will be released. Therefore, we assume that Trump-related news—tariffs and unrest in the U.S.—will again take center stage in terms of market impact.
Illustration Explanations:
- Support and resistance price levels – thick red lines where movement may end. They are not trading signal sources.
- Kijun-sen and Senkou Span B lines—These are strong Ichimoku indicator lines transferred to the hourly timeframe from the 4-hour one.
- Extremum levels – thin red lines where the price has previously rebounded. These act as trading signal sources.
- Yellow lines – trend lines, trend channels, and other technical patterns.
- COT Indicator 1 on the charts – the size of the net position for each category of traders.