GBP/USD 5-Minute Analysis
On Thursday, the GBP/USD currency pair traded strictly sideways with low volatility. Despite a busy macroeconomic calendar, the market ignored most of the data, just as anticipated. In the UK, the GDP report for the first quarter was fairly positive, showing 0.7% growth, but the industrial production report came in weaker than expected. As a result, the British pound saw no gains. In fact, we did not anticipate a strong market reaction, even if the reports had been solid or disappointing. Regarding U.S. data, it's not even worth mentioning since traders chose to ignore it.
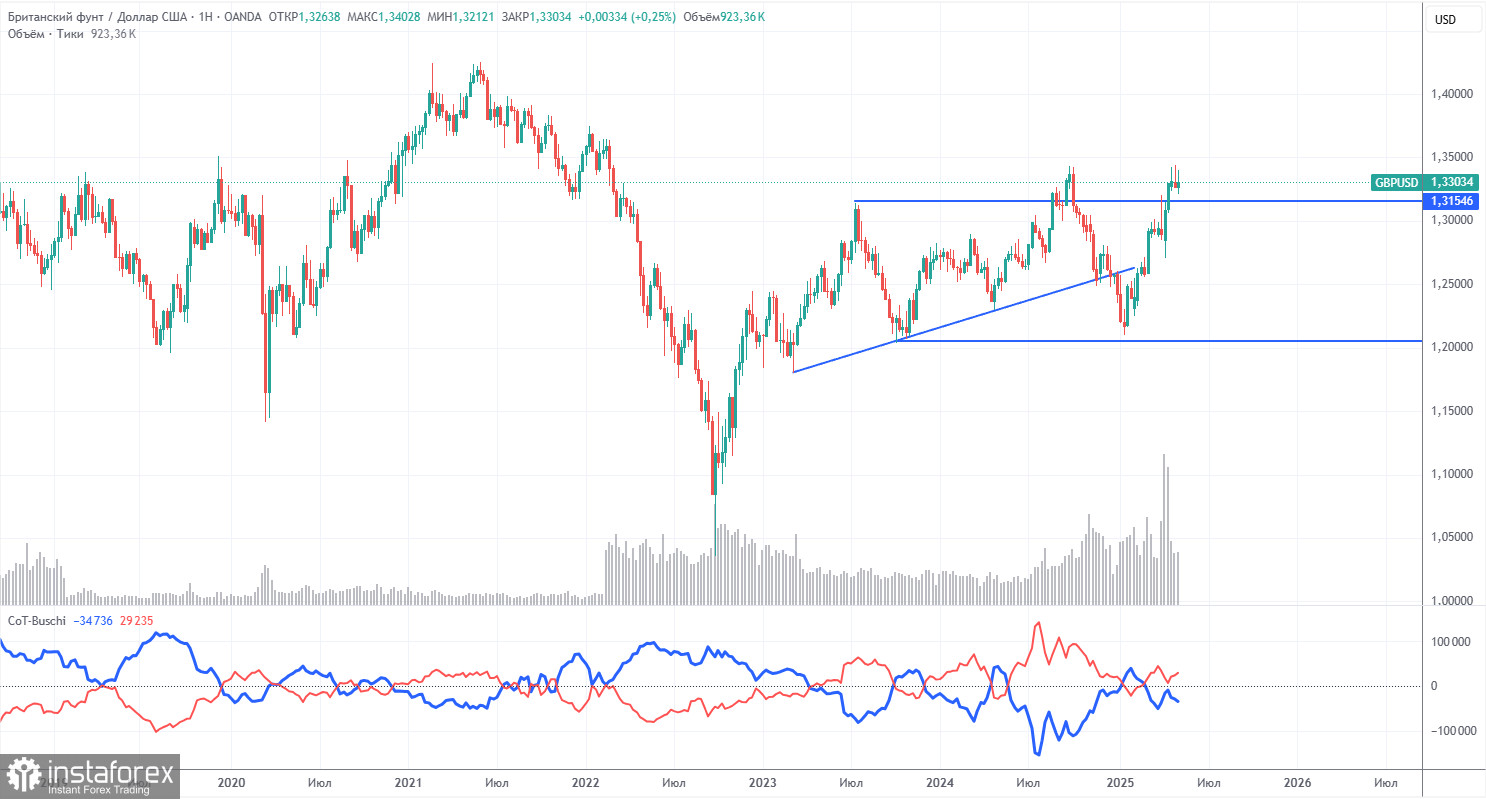
Thus, after a sharp drop on Monday and an equally sharp rally on Tuesday and Wednesday, the market chose to rest on Thursday. Technically, the bearish trend remains in place, but even on the hourly timeframe, it's clear how weak it is. The size of the corrections is nearly identical to that of the trend movements. The U.S. dollar continues to lack demand despite reasonably strong fundamental backing. From a technical standpoint, the price remains below the Senkou Span B line, which keeps the "bearish bias" intact, but the dollar still struggles to attract traders.
On the 5-minute chart, we didn't even mark all the signals, as the price fluctuated up and down all day, and ignored the only technical level on the chart. By the end of the day, we removed the 1.3288 level from the charts. Over the past month, the pair has been moving sideways more often than up or down.
COT Report
COT reports for the British pound show that commercial traders' sentiment has fluctuated frequently in recent years. The red and blue lines, representing net positions of commercial and non-commercial traders, cross regularly and typically remain near the zero line. They are again close to each other, indicating roughly equal numbers of long and short positions.
In the weekly timeframe, the price broke below the 1.3154 level, then broke a trend line, returned to 1.3154, and broke again. Breaking the trend line indicates a high probability that the pound will continue to fall. However, we see that the dollar keeps dropping due to Donald Trump. Therefore, the trade war news could continue pushing the pound higher despite technical factors.
According to the latest COT report on the British pound, the "Non-commercial" group opened 3,300 long contracts and closed 1,900 short contracts, increasing their net position by 5,200 contracts.
The fundamental backdrop still offers no justification for long-term purchases of the pound sterling, and the currency has real chances to resume a global downtrend. The pound has risen sharply recently, but we must remember that Donald Trump's policy is the sole reason. Once that factor is removed, the dollar may begin to strengthen.
GBP/USD 1-Hour Analysis
In the hourly timeframe, GBP/USD broke out of its sideways channel and began a downtrend. However, it was very short-lived. Any continuation of the decline depends entirely on Donald Trump and developments in the global trade war. If tensions continue to ease and trade deals are signed, the dollar could resume strengthening. However, it's important to note that the market still doesn't favor the U.S. dollar and does not fully trust that the trade conflict is on a path toward resolution.
Key Levels for May 16: 1.2691–1.2701, 1.2796–1.2816, 1.2863, 1.2981–1.2987, 1.3050, 1.3125, 1.3212, 1.3288, 1.3358, 1.3439, 1.3489, 1.3537. Ichimoku Lines: Senkou Span B – 1.3328, Kijun-sen – 1.3248. The Senkou Span B and Kijun-sen lines may shift throughout the day and should be considered when identifying trade signals. Setting a Stop Loss at breakeven once the price moves 20 pips in the correct direction is also recommended to minimize risk.
No significant reports or events are scheduled in the UK on Friday, and in the U.S., the only noteworthy release is the University of Michigan Consumer Sentiment Index. However, like many reports in recent months, it has very little chance of sparking a strong market reaction. The British pound will almost certainly spend Friday in a sideways range, as this has been its preferred direction in most cases for the past month.
Illustration Explanations:
- Support and resistance price levels – thick red lines where movement may end. They are not trading signal sources.
- Kijun-sen and Senkou Span B lines—These are strong Ichimoku indicator lines transferred to the hourly timeframe from the 4-hour one.
- Extremum levels – thin red lines where the price has previously rebounded. These act as trading signal sources.
- Yellow lines – trend lines, trend channels, and other technical patterns.
- COT Indicator 1 on the charts – the size of the net position for each category of traders.