empty
 
 
13.08.2025 11:56 AM
Forecast for EUR/USD on August 13, 2025

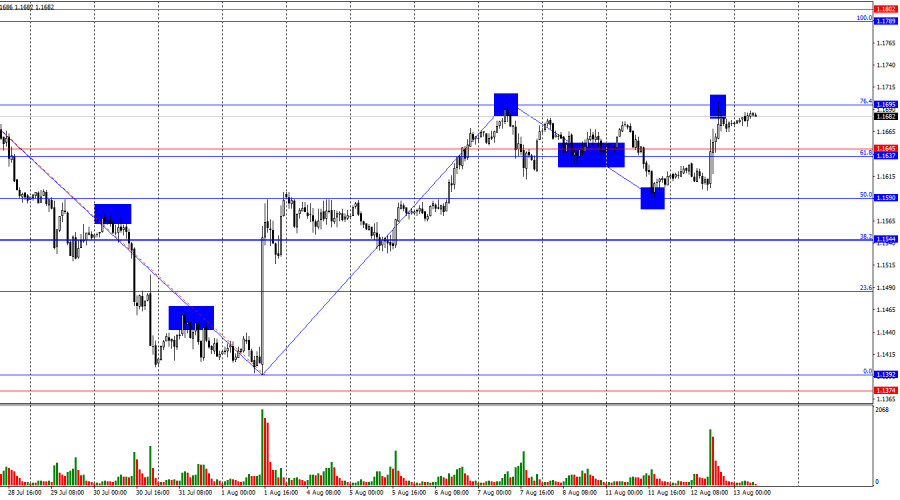
On Tuesday, the EUR/USD pair continued its upward movement after rebounding from the 50.0% retracement level at 1.1590. It also consolidated above the resistance zone of 1.1637–1.1645 and reached the 1.1695 level. A rebound from this level would favor the U.S. currency and lead to a decline toward the 1.1637–1.1645 zone and the 1.1590 level. A close above 1.1695 would increase the likelihood of continued growth toward the next resistance zone at 1.1789–1.1802.

This image is no longer relevant

The wave structure on the hourly chart remains straightforward. The last completed upward wave did not break the high of the previous wave, and the last completed downward wave did not break the previous low. Therefore, the trend can still be considered bearish for now, although it has been changing frequently due to the news background. Donald Trump managed to sign several beneficial deals, which gave bears strength, along with Jerome Powell's remarks after the latest Fed meeting. However, recent labor market data and the changing outlook for the Fed's monetary policy are now supporting the bulls.

On Tuesday, one report was enough for traders to choose fresh selling of the U.S. dollar. It turned out that the U.S. inflation report came in lower than traders had expected. In July, the Consumer Price Index rose by 2.7% year-on-year, while core inflation increased slightly to 3.1%. It is difficult to say which of these two indicators is more important, but the market viewed the inflation growth rate as weak, which gives the FOMC the opportunity to cut interest rates in September without significant risk. Overall, the current situation can be described as follows: inflation is rising slowly, while the U.S. labor market is showing signs of concern. Thus, the FOMC's top priority is now to stabilize the labor market, which requires a rate cut. If inflation were rising at a faster pace, there could be doubts about policy easing — but not with the current pace of price growth.

This image is no longer relevant

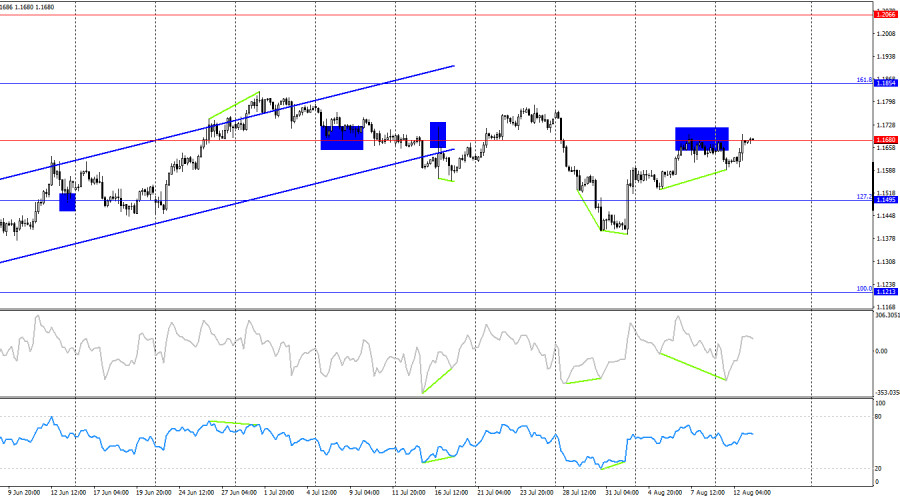
On the 4-hour chart, the pair reversed in favor of the euro and rose to the 1.1680 level after forming two bullish divergences. A rebound from this level would allow for a decline toward the 127.2% retracement level at 1.1495. A close above 1.1680 would increase the likelihood of continued growth toward the next 161.8% Fibonacci level at 1.1854. Currently, no emerging divergences are observed in any indicator, and a move below the ascending channel does not necessarily mean a bearish trend must form.

Commitments of Traders (COT) Report:

This image is no longer relevant

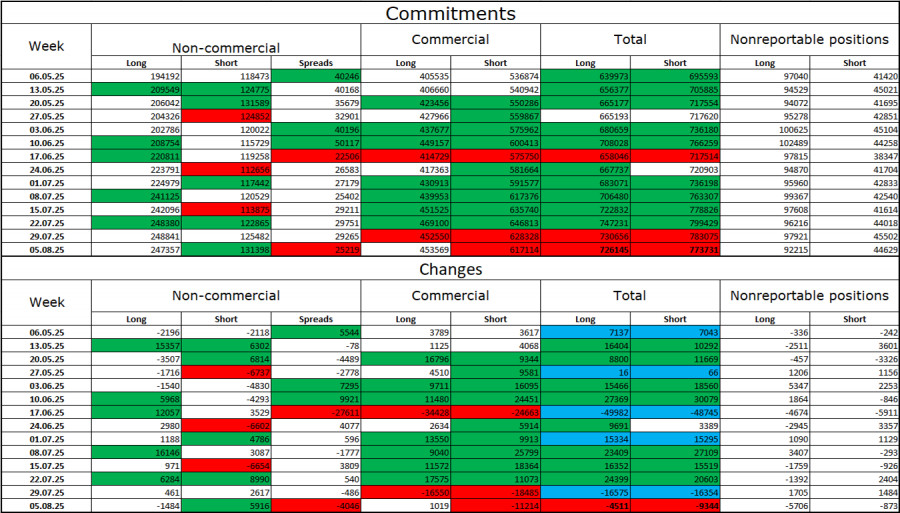
During the last reporting week, professional traders closed 1,848 long positions and opened 5,916 short positions. The sentiment of the "Non-commercial" group remains bullish thanks to Donald Trump and is strengthening over time. The total number of long positions held by speculators now stands at 247,000, while short positions amount to 131,000 — nearly a twofold difference. In addition, note the large number of green cells in the table above, reflecting strong increases in positions on the euro. In most cases, interest in the euro is only growing, while interest in the dollar is declining.

For twenty-six consecutive weeks, large players have been reducing short positions and increasing long positions. Donald Trump's policy remains the most significant factor for traders, as it may cause numerous problems with long-term and structural consequences for the United States. Despite the signing of several important trade agreements, some key economic indicators are showing a decline.

News Calendar for the U.S. and the Eurozone:

Eurozone – Germany Consumer Price Index (06:00 UTC).

On August 13, the economic calendar contains no important entries. The news background is unlikely to influence market sentiment on Wednesday.

EUR/USD Forecast and Trading Recommendations:

Selling opportunities may arise from a rebound from the 1.1695 level on the hourly chart, with targets at 1.1637–1.1645 and 1.1590. Buying was possible from a rebound at 1.1590 on the hourly chart, with targets at 1.1637 and 1.1695 — both targets have been reached. Today, buying is possible if the price closes above 1.1695.

The Fibonacci grids are built from 1.1789–1.1392 on the hourly chart and from 1.1214–1.0179 on the 4-hour chart.

Samir Klishi,
Analytical expert of InstaForex
© 2007-2025
Summary
Urgency
Analytic
Grigory Sokolov
Start trade
Earn on cryptocurrency rate changes with InstaForex
Download MetaTrader 4 and open your first trade
  • Grand Choice
    Contest by
    InstaForex
    InstaForex always strives to help you
    fulfill your biggest dreams.
    JOIN CONTEST
  • Chancy Deposit
    Deposit your account with $3,000 and get $1000 more!
    In August we raffle $1000 within the Chancy Deposit campaign!
    Get a chance to win by depositing $3,000 to a trading account. Having fulfilled this condition, you become a campaign participant.
    JOIN CONTEST
  • Trade Wise, Win Device
    Top up your account with at least $500, sign up for the contest, and get a chance to win mobile devices.
    JOIN CONTEST
  • 100% Bonus
    Your unique opportunity to get a 100% bonus on your deposit
    GET BONUS
  • 55% Bonus
    Apply for a 55% bonus on your every deposit
    GET BONUS
  • 30% Bonus
    Receive a 30% bonus every time you top up your account
    GET BONUS

Recommended Stories

Can't speak right now?
Ask your question in the chat.
Widget callback