Bitcoin continues its decline, showing no signs of making a small pause, while crypto experts speak of new price records in 2026. The daily chart clearly shows that none of the last three FVGs have been worked off. On the 4-hour timeframe, it is clear that none of the last three FVGs have been addressed. What does this indicate? It indicates that Bitcoin is not correcting at all. The market is experiencing a total collapse, with a flight from risk. Last night, the second target we discussed—at $70,800—was reached. Thus, traders could have earned well even at this point based on our recommendations. Recall that before the new drop, Bitcoin formed a clear sell signal in the "bearish" FVG on the daily chart.
What should be expected from Bitcoin going forward? Clearly, not the dynamics of gold. In 2026, investors remembered that gold is gold, and there will not be more of it on Earth; however, Bitcoin currently has a limited issuance. If in 10 or 20 years the code is slightly "tweaked," it would indeed be possible to issue several tens of millions more coins. Regarding its use as a means of payment, Bitcoin is still very rarely utilized, primarily only for illegal transactions. Even those transactions often go into stablecoins like USDT. Thus, Bitcoin remains an "investment toy for the wealthy," as retail traders increasingly shift their attention to cheaper coins with greater growth potential.
Just yesterday, Cathie Wood, head of the Ark Invest fund, stated that she expects Bitcoin to reach $1.5 million per coin. And all those who do not buy Bitcoin now will regret it later. How many such assertions have we heard already? It is essential to remind again that investing and trading are different concepts. Cathie Wood and her investors can invest millions in an asset and wait for years and decades. For traders, it is crucial to follow the trend. Currently, the trend is downward.
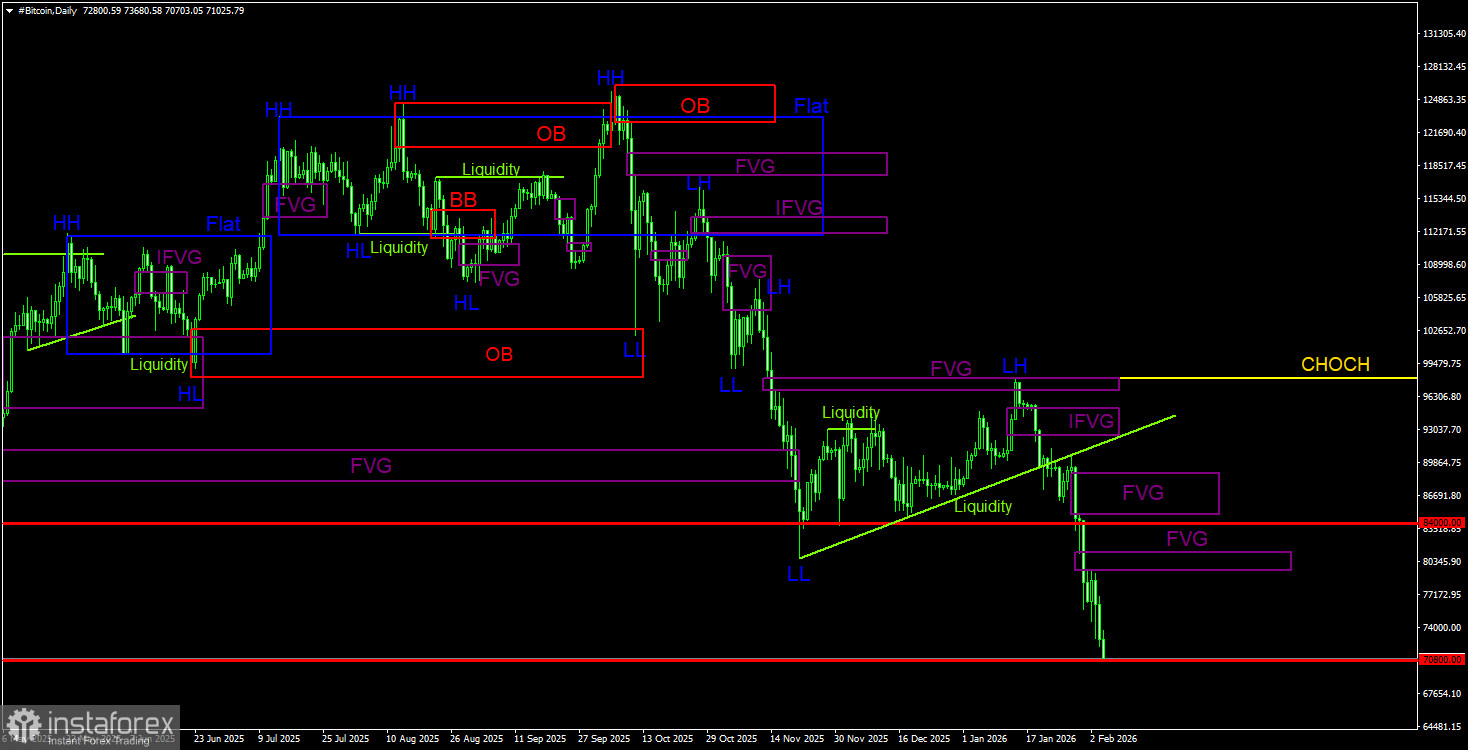
Overall Picture of BTC/USD on the 1D Chart
On the daily timeframe, Bitcoin continues to trend lower. The trend structure is bearish, with the CHOCH line currently at $97,900. Only above this level can we say that the downward trend has ended. "In 2026, Bitcoin could fall to as low as $60,000." We said this earlier. Now, Bitcoin is only $10,000 away from $60,000. What is $10,000 for an asset that has lost $55,000 in just a few months? The price has reacted quite clearly to the "bearish" FVG ($96,900 – $98,000), and a trading signal was formed. Since then, Bitcoin has already lost around $25,000. The next target for the downward movement will be the $57,500 level, 50.0% according to Fibonacci. There are currently three areas for selling POIs, and new ones may form soon. But what is the point of these areas if Bitcoin is not correcting?
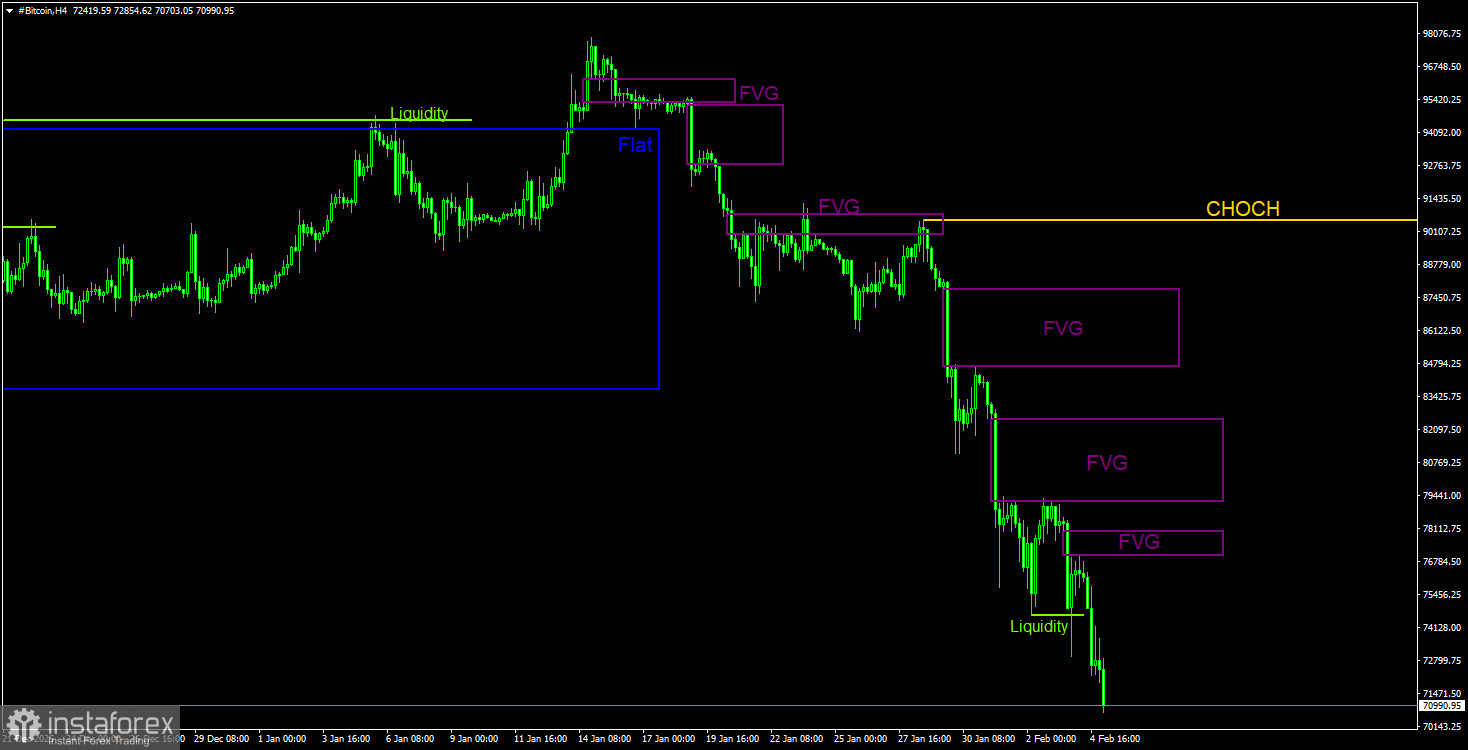
Overall Picture of BTC/USD on the 4H Chart
On the 4-hour timeframe, the price continues to form a new bearish structure. The CHOCH line now stands at $90,560; only above that level can we discuss a trend shift to an upward direction. However, at present, there are no signs that Bitcoin will end its decline anytime soon. On the contrary, the price is collapsing at lightning speed, showing no signs of minimal corrections. During the last leg of the decline, four "bearish" FVGs were formed. Currently, Bitcoin has failed to correct to any of them. The liquidity removal on the buying side is merely a warning of a potential rise, but it is the only indication of possible growth.
Trading Recommendations for BTC/USD:
Bitcoin continues to form a full downward trend. We expect a decline towards the $57,500 level (the 61.8% Fibonacci level from a three-year upward trend), and there are no signs of a trend reversal or correction. From the POI areas for selling on the daily and 4-hour timeframes, we can highlight several "bearish" FVGs, but there is currently no point in them—the price is not correcting. In the future, they can be considered for opening new shorts.
Explanations for Illustrations:
- CHOCH – Change of Character in trend structure.
- Liquidity – The liquidity of Stop Loss orders from traders that market-makers use to build their positions.
- FVG – Fair Value Gap; prices move through such areas extremely quickly, indicating a complete absence of one side in the market. Subsequently, prices tend to return and react to such areas.
- IFVG – Inverted Fair Value Gap. After a return to such an area, the price does not react but breaks through impulsively and then tests it from the opposite side.
- OB – Order Block; the candle where the market-maker opened a position to collect liquidity for forming its own position in the opposite direction.