Trade Analysis of Tuesday:
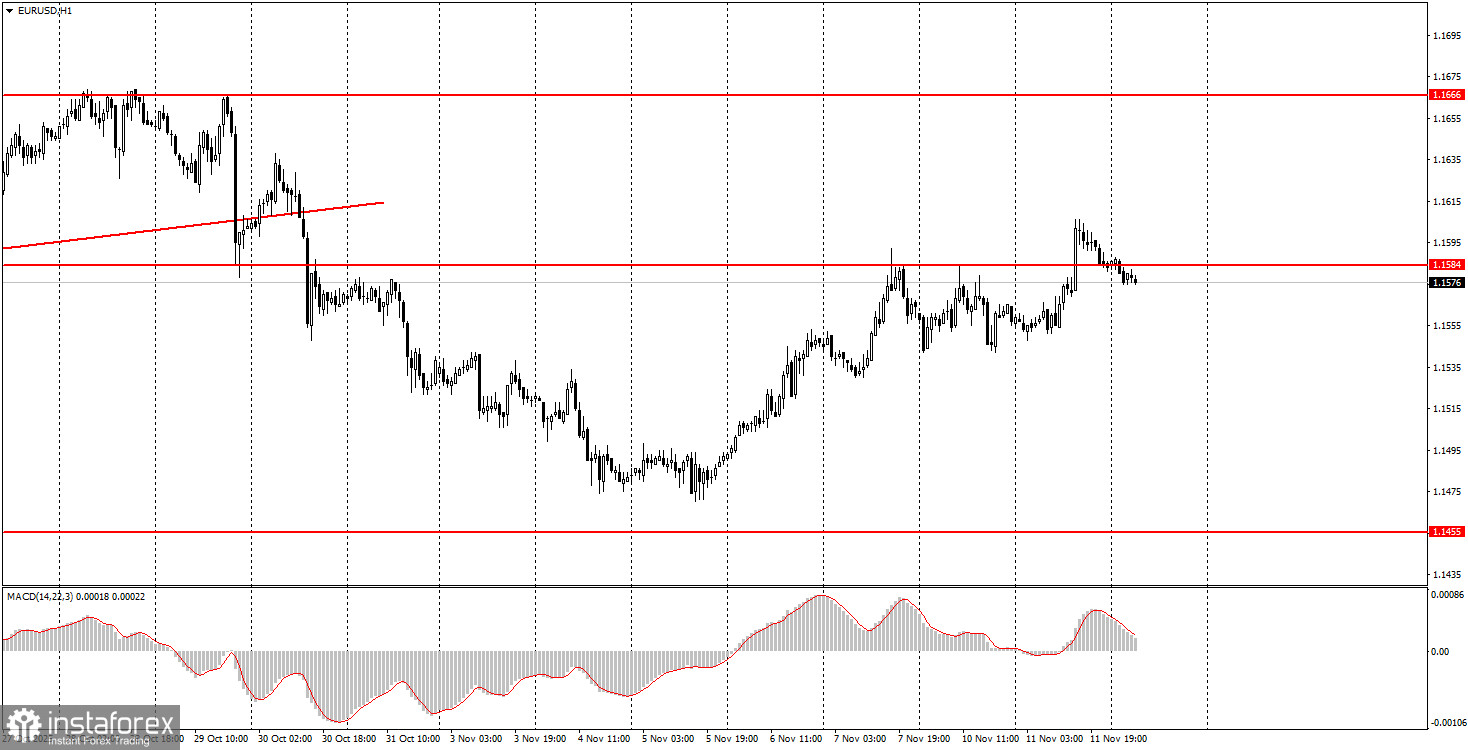
1H Chart of the EUR/USD Pair
The EUR/USD currency pair continued its upward movement on Tuesday, despite virtually no macroeconomic data or fundamental events. Recall that on Monday, Donald Trump announced that the "shutdown" could end this week, which should have supported the US dollar. However, the dollar fell for two consecutive days, further proving the illogical current movements in the market, caused by the flat on the daily timeframe. Two not-so-important ZEW economic sentiment indices were released yesterday in Germany and the EU. The European index turned out slightly better than forecasts, while the German one was worse. Thus, the data did not provide any special grounds for the growth of the euro currency. However, we also remind you that the dollar rose illogically throughout October and early November. When it comes to global factors and the medium-term outlook, any growth in the pair (i.e., a decline in the US currency) is logical and warranted, while any decline is corrective and unfounded. Therefore, we expect the upward movement to continue.
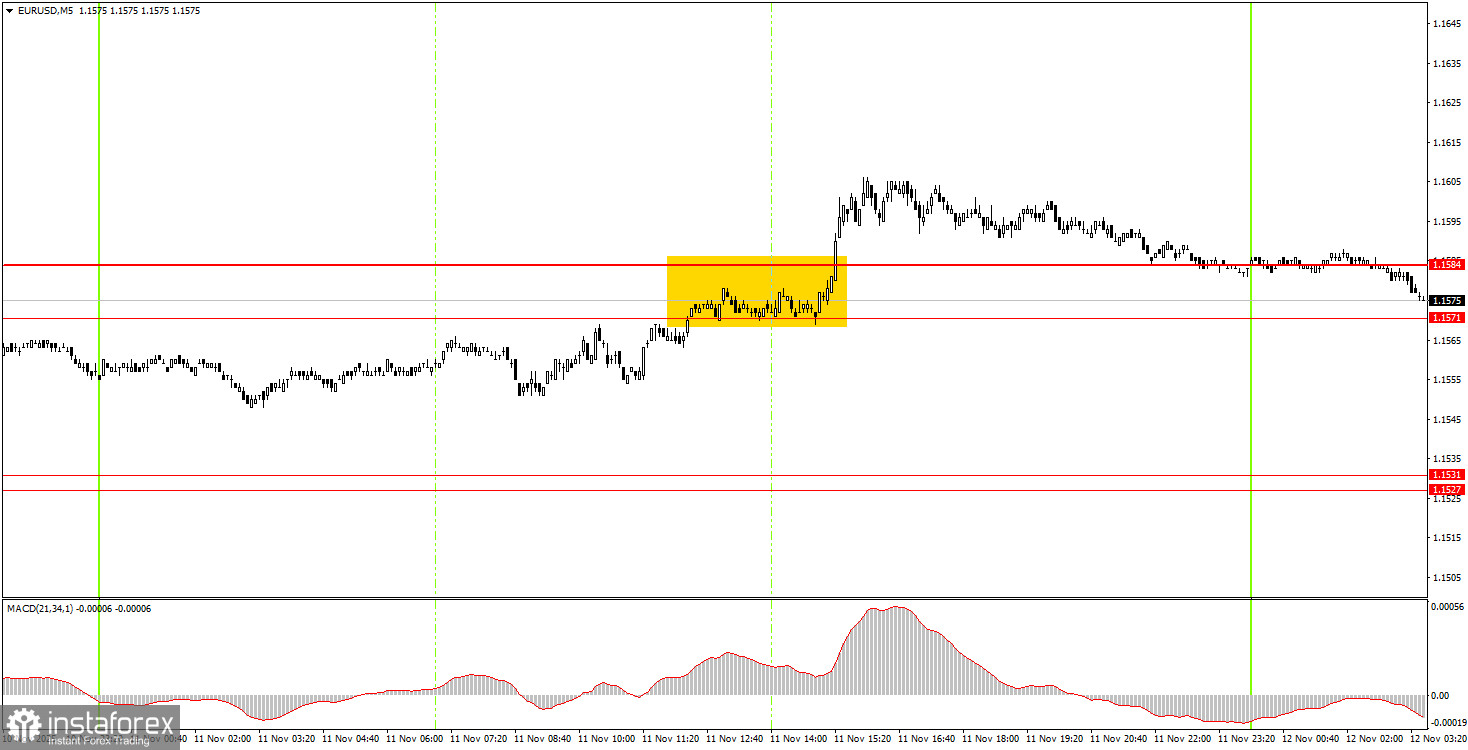
5M Chart of the EUR/USD Pair
On the 5-minute timeframe, one buy signal was formed on Tuesday. The price during the American trading session broke through the 1.1571-1.1584 range, enabling novice traders to open long positions. The upward movement did not continue after the signal was formed, and the price returned to the 1.1571-1.1584 area. A rebound from this level today will allow traders to remain in long positions.
How to Trade on Wednesday:
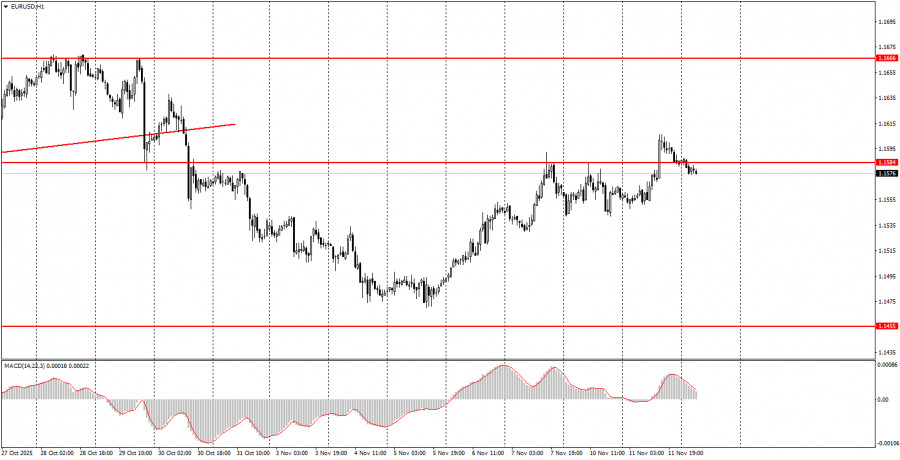
On the hourly timeframe, the EUR/USD pair still maintains a downward trend, but it may soon end. The overall fundamental and macroeconomic background remains very weak for the US dollar. Thus, on technical grounds alone, the European currency may continue its decline – the flat on the daily timeframe remains relevant. However, we await its completion and the resumption of the upward trend for 2025.
On Wednesday, novice traders can once again trade from the 1.1571-1.1584 area. A rebound from this area will allow for staying in long positions or opening new ones with a target of 1.1655. A price consolidation below the 1.1571-1.1584 area will make short positions relevant with a target of 1.1527-1.1531.
On the 5-minute timeframe, the levels to consider are 1.1354-1.1363, 1.1413, 1.1455-1.1474, 1.1527-1.1531, 1.1571-1.1584, 1.1655-1.1666, 1.1745-1.1754, 1.1808, 1.1851, 1.1908, 1.1970-1.1988. On Wednesday, no major or even interesting events are scheduled in the US and the EU. The only report worth noting is the second estimate of German inflation for October. However, this is an entirely secondary report.
Key Principles of My Trading System:
- The strength of the signal is considered based on the time taken to form the signal (bounce or breach of a level). The less time taken, the stronger the signal.
- If two or more trades have been opened around a certain level based on false signals, all subsequent signals from that level should be ignored.
- In a flat market, any pair can create numerous false signals or may not form them at all. In any case, it's best to stop trading at the first signs of a flat.
- Trading deals are opened during the period between the start of the European session and the middle of the American session, after which all deals should be closed manually.
- On the hourly timeframe, it is preferable to trade based on signals from the MACD indicator only when there is good volatility and a trend that is confirmed by a trend line or trend channel.
- If two levels are too close to each other (between 5 and 20 pips), they should be treated as an area of support or resistance.
- After a 15-pip move in the right direction, a Stop Loss should be set to breakeven.
What the Charts Show:
- Support and resistance price levels are targets for opening buy or sell positions. Take Profit levels can be placed around them.
- Red lines indicate trend channels or trend lines, reflecting the current trend and indicating the preferred trading direction.
- The MACD indicator (14,22,3) — histogram and signal line — is a supplementary indicator that can also be used as a source of signals.
Important announcements and reports (always available in the news calendar) can significantly impact the movement of the currency pair. Therefore, during their release, it is recommended to trade with maximum caution or to exit the market to avoid sharp reversals against the preceding movement.
Beginners trading on the Forex market should remember that not every trade can be profitable. Developing a clear strategy and money management is key to long-term success in trading.