The EUR/USD currency pair traded with weak volatility on Monday, which came as no surprise given the complete absence of macroeconomic and fundamental events throughout the day. As forecasted, volatility was low. Therefore, there is essentially nothing new to add to previously published analyses. Any kind of U.S. dollar strength at this point seems illogical—especially on a Monday lacking any justification for USD gains, with ongoing protests and unrest across the United States aimed at Donald Trump.
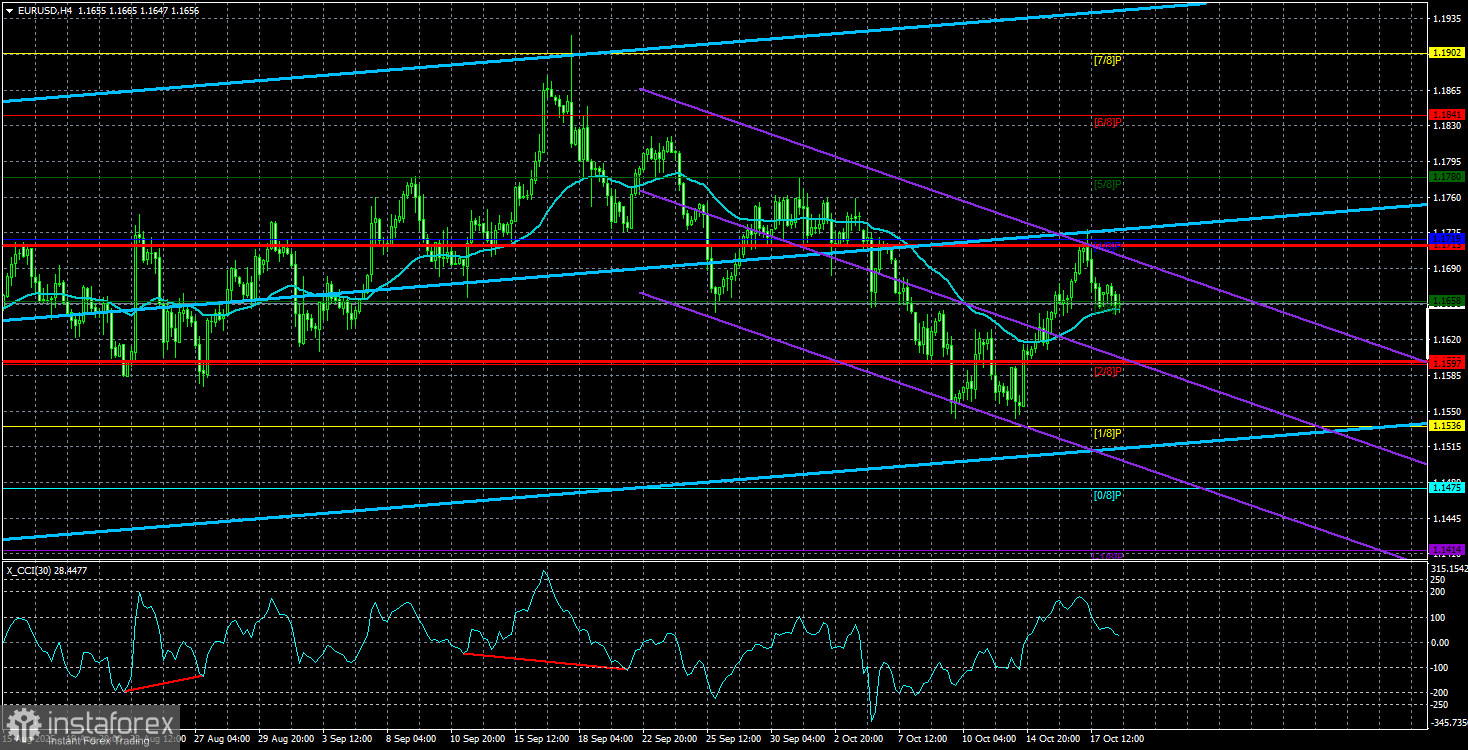
Given this, the only logical step today is to look ahead at upcoming events for the rest of the week and attempt to assess what to expect. First, let's clarify our technical stance: we expect upward movement above the moving average and consider any decline below it as illogical and corrective in nature. While this may sound too simplistic, what it means is: as long as the price is above the moving average, long positions remain valid. If the price dips below, any sell trades should be entered with the understanding they are against the broader trend.
The daily timeframe remains the most informative. On it, we clearly see not a correction (i.e. dollar growth), but a flat market that has persisted for several months. Therefore, it cannot currently be said that the U.S. currency is strengthening.
The main event this week is undoubtedly the U.S. inflation report—not because of its influence on the Fed's monetary policy, but simply because it is nearly the only important report scheduled for the entire month. Due to the ongoing U.S. government shutdown, key labor market and unemployment data remain unavailable until Democrats and Republicans reach a consensus.
Another event to monitor is European Central Bank President Christine Lagarde's speech—though she has already spoken at least ten times in recent weeks without delivering any market-moving news. The latest inflation report in the eurozone showed slightly stronger-than-expected numbers, but it does little to change the ECB's stance. If inflation is rising, it means rates cannot be cut further, yet tightening policy is not an option either.
On Friday, PMI data for the eurozone's services and manufacturing sectors will be released for October, but these are generally not high-impact reports and rarely trigger strong market reactions.
Overall, this week traders should focus on Donald Trump's commentary on China and the U.S. inflation report. That's essentially the entire fundamental calendar.
From a technical perspective, a new drop in the EUR/USD pair is not impossible. The daily chart still allows for a 150-pip decline within the flat structure. However, until we see a confirmed downward trend, selling the pair comes with increased risk and is not currently advisable.
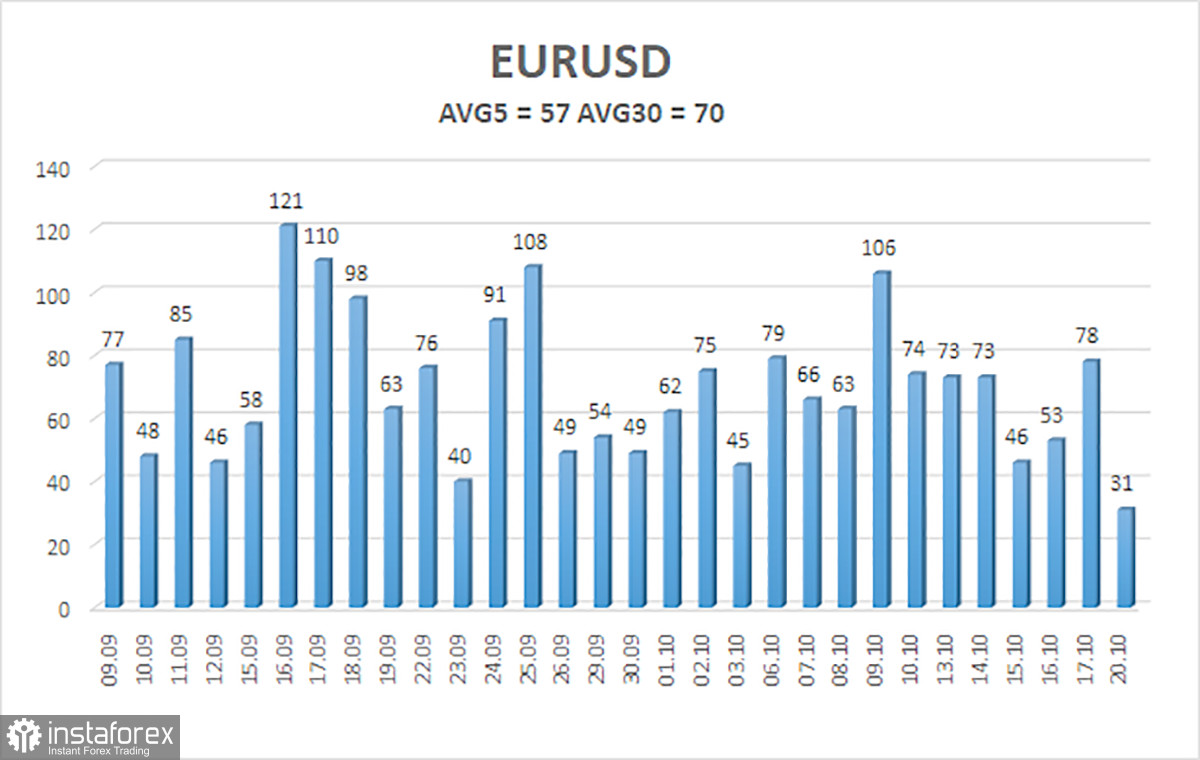
The average volatility of the EUR/USD pair over the last five trading days (as of October 21) is 57 pips, which is considered "average." On Tuesday, we expect movement between the levels of 1.1599 and 1.1713. The upper linear regression channel is pointing upwards, which confirms the ongoing bullish trend. The CCI has recently entered the oversold zone, which may spark a new wave of upward momentum.
Nearest Support levels:
S1 – 1.1658
S2 – 1.1597
S3 – 1.1536
Nearest Resistance levels:
R1 – 1.1719
R2 – 1.1780
R3 – 1.1841
Trading Recommendations:
EUR/USD is attempting to start a new uptrend on the H4 chart, while the uptrend remains intact across higher timeframes. The U.S. dollar remains under heavy pressure due to Donald Trump's unpredictable policies, which show no signs of slowing down. While the dollar has strengthened locally in recent sessions, its fundamental basis is weak. The ongoing flat structure on the daily timeframe continues to explain much of the sideways movement.
If the price moves above the moving average line, buying remains relevant, with targets at 1.1841 and 1.1902 in line with the trend. If the price drops below the moving average, short positions can be considered on a technical basis, with downside targets at 1.1536. However, these should be treated as corrective rather than trend-continuation trades.
Explanation of Chart Tools:
- Linear Regression Channels: Help identify the current trend. If both channels are pointing in the same direction, it indicates a strong, directional trend.
- Moving Average Line (settings 20,0, smoothed): Identifies short-term momentum and the recommended trading direction.
- Murray Levels: Serve as target zones for both expansion and correction phases.
- Volatility Levels (Red Lines): Represent the expected price range over the next 24 hours based on current volatility data.
- CCI Indicator: Values above +250 or below -250 suggest overbought or oversold conditions, signaling a potential trend reversal.