Thursday Trade Review:
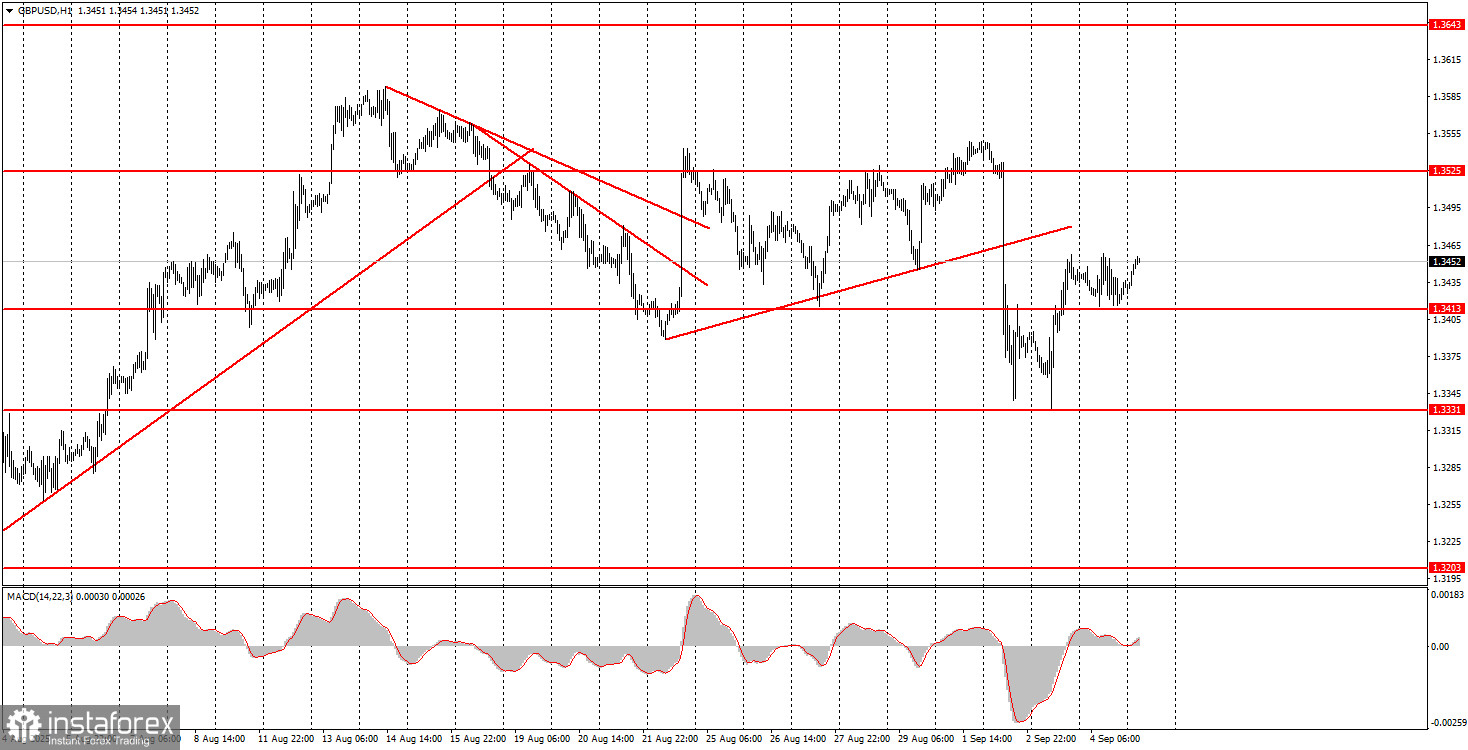
1H Chart of GBP/USD
The GBP/USD pair traded in absolute flat conditions on Thursday. The day's total volatility was just 45 pips, despite the release of another report significant for the US dollar. Recall that this week saw JOLTs and ADP reports, as well as ISM Manufacturing and Services PMI figures. Each of these is important in its own way, and most showed weak results (except for the ISM Services PMI). Thus, the US dollar could have continued its decline this week, but instead, the market suddenly decided to react to Tuesday's record surge in UK government bond yields. At the moment, the British pound has partially recovered from its drop and has managed to consolidate above the 1.3413 level. Today, there will be important reports from the US on unemployment and Nonfarm Payrolls. These data could trigger high volatility. The Fed's September 17 interest rate decision will partly depend on these releases. At the moment, traders do not doubt a rate cut, but it's better to draw final conclusions after the labor market and inflation reports.
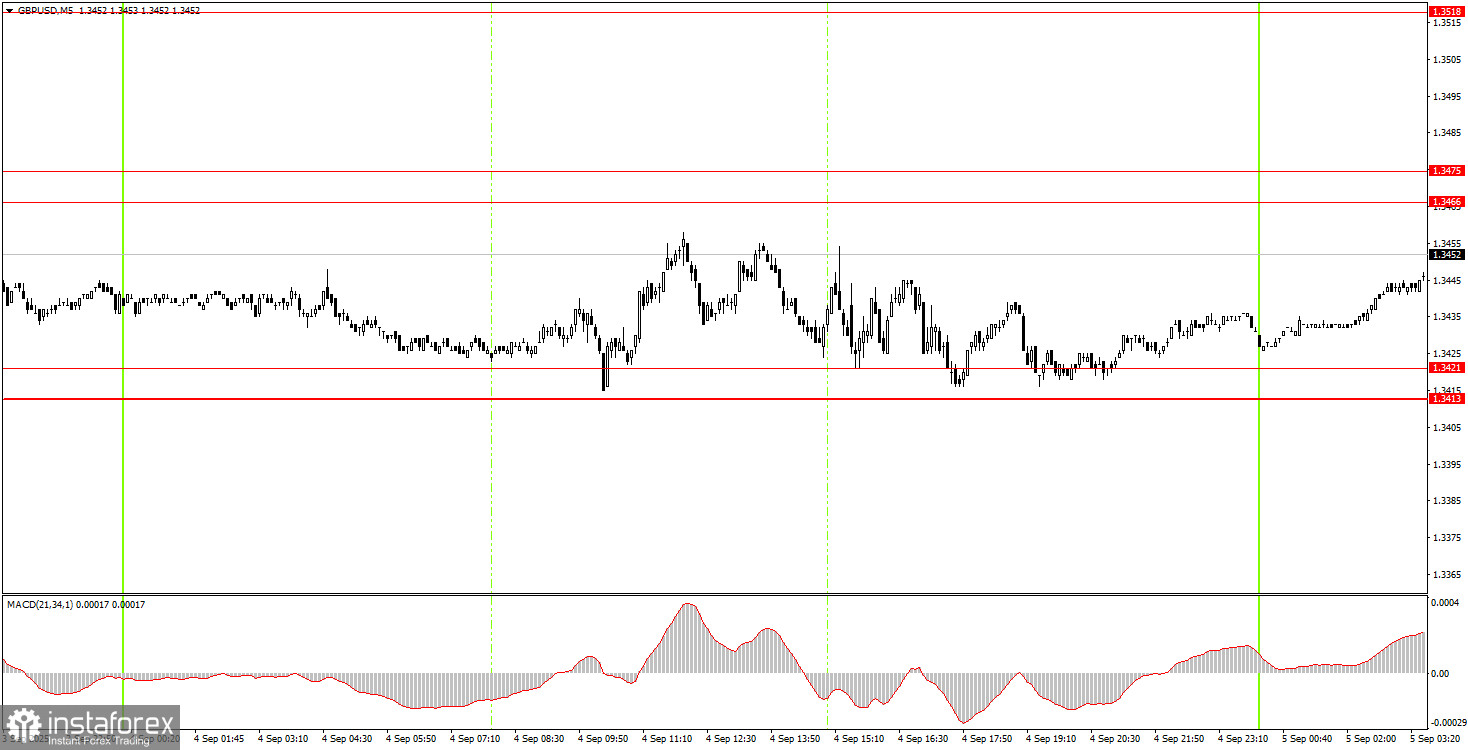
5M Chart of GBP/USD
On the 5-minute chart Thursday, several trading signals were formed—but the flat and low volatility spoiled everything. The price bounced off the 1.3413–1.3421 area at least four times, which allowed beginner traders to open long positions. Not once did the price manage to reach the nearest target area of 1.3466–1.3475, which is quite close. The pound sterling just barely moved the necessary 20 pips upward to set a breakeven Stop Loss, so most likely, long positions were closed at no profit, no loss.
How to Trade on Friday:
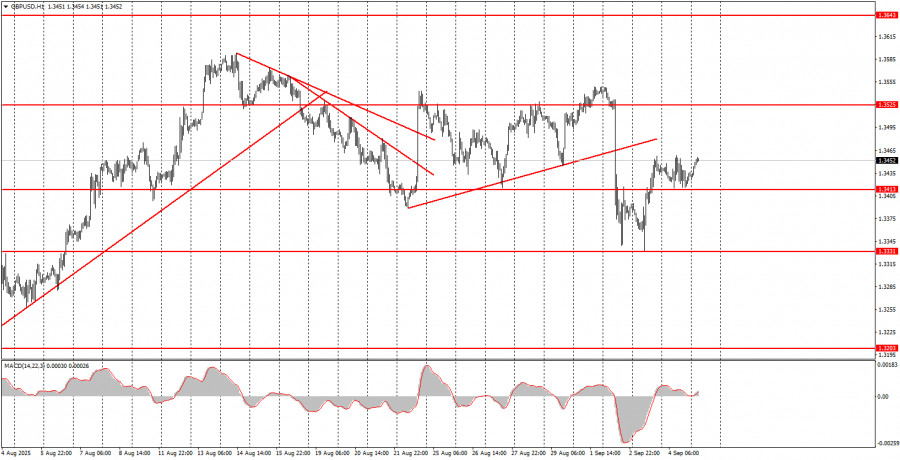
On the hourly chart, GBP/USD showed a desire to continue the global downward correction, though it could end at any moment since the dollar still lacks any reason for growth other than technical ones. Thus, we allow for some decline in select macroeconomic reports or technical factors, but in the medium term, we expect the resumption of the global uptrend.
On Friday, the GBP/USD pair may continue moving up, since yesterday it bounced four times from the 1.3413–1.3421 area. Thus, longs remain relevant with a target of 1.3466–1.3475. Breaking through this area would allow further buys targeting 1.3518, but today important US data could also trigger a drop in the pair.
On the 5-minute timeframe, the current levels to trade are 1.3102–1.3107, 1.3203–1.3211, 1.3259, 1.3329–1.3331, 1.3413–1.3421, 1.3466–1.3475, 1.3518–1.3532, 1.3574–1.3590, 1.3643–1.3652, 1.3682, 1.3763. For Friday, a retail sales report in the UK is scheduled—the first such report this week. In the US, truly important labor market and unemployment data will be published, which could spark a "storm" in the markets.
Core Trading System Rules:
- Signal Strength: The shorter the time it takes for a signal to form (a rebound or breakout), the stronger the signal.
- False Signals: If two or more trades near a level result in false signals, subsequent signals from that level should be ignored.
- Flat Markets: In flat conditions, pairs may generate many false signals or none at all. It's better to stop trading at the first signs of a flat market.
- Trading Hours: Open trades between the start of the European session and the middle of the US session, then manually close all trades.
- MACD Signals: On the hourly timeframe, trade MACD signals only during periods of good volatility and a clear trend confirmed by trendlines or trend channels.
- Close Levels: If two levels are too close (5–20 pips apart), treat them as a support or resistance zone.
- Stop Loss: Set a Stop Loss to breakeven after the price moves 20 pips in the desired direction.
Key Chart Elements:
Support and Resistance Levels: These are target levels for opening or closing positions and can also serve as points for placing Take Profit orders.
Red Lines: Channels or trendlines indicating the current trend and the preferred direction for trading.
MACD Indicator (14,22,3): A histogram and signal line used as a supplementary source of trading signals.
Important Events and Reports: Found in the economic calendar, these can heavily influence price movements. Exercise caution or exit the market during their release to avoid sharp reversals.
Forex trading beginners should remember that not every trade will be profitable. Developing a clear strategy and practicing proper money management are essential for long-term trading success.