The GBP/USD currency pair remained stagnant for most of Wednesday. Let's recall an old technical signal: if the price updates a significant extreme and immediately pulls back, there is a good chance of a noticeable correction. This pattern usually indicates that traders lacked the strength to consolidate above or below a certain level. Look at yesterday: the price easily updated its previous three-year high and then simply stayed flat. This indicates that even at three-year highs, there are no sellers for GBP/USD.
Thus, a new downward correction might begin now, but we have little doubt that the British currency will continue to rise. Just consider the following: The dollar plummeted even when the Bank of England cut its key rate while the Federal Reserve did not. Now, the market expects the Fed to ease its monetary policy as early as July or in the fall, signaling a more dovish stance. Meanwhile, the BoE is ready to take a prolonged pause, as inflation has risen sharply in recent months, and the Monetary Policy Committee has even started talking about its possible stabilization at current levels. This means inflation in the UK may get stuck above 3% again despite dropping to 1.7% a year ago. Naturally, the BoE is unlikely to lower rates in the near term.
So what's the outcome? Even if the Fed is not officially preparing for easing, the market is. The BoE cut rates earlier, but it is unlikely to make further cuts at upcoming meetings. If the dollar was falling even with a favorable monetary and fundamental background, what should we expect from it under negative conditions?
Let's also remind you that July 9 marks the end of Donald Trump's "grace period." This means that any countries failing to present the U.S. with an "offer it can't refuse" by that date will once again be slapped with tariffs up to their ears. Of the three months of grace, 2.5 have already passed. During that time, only London has managed to finalize a deal.
Traders may wonder: What does U.S. trade policy have to do with the pound if the UK deal is already secured? The deal with Britain is indeed signed, but if negotiations with the remaining countries collapse, demand for the U.S. dollar will once again plummet. Consequently, the American currency will be sold off, and other currencies—like the euro, pound, yen, and franc—will be bought instead. Therefore, further gains in these currencies are entirely plausible.
Incidentally, Trump regularly criticizes Jerome Powell for his refusal to lower the key interest rate. Just imagine where the dollar would go if the Fed cut the rate by 2–3% as Trump wants. In the past, we at least acknowledged some grounds for possible dollar strengthening, but now the picture for the American currency looks entirely bleak.
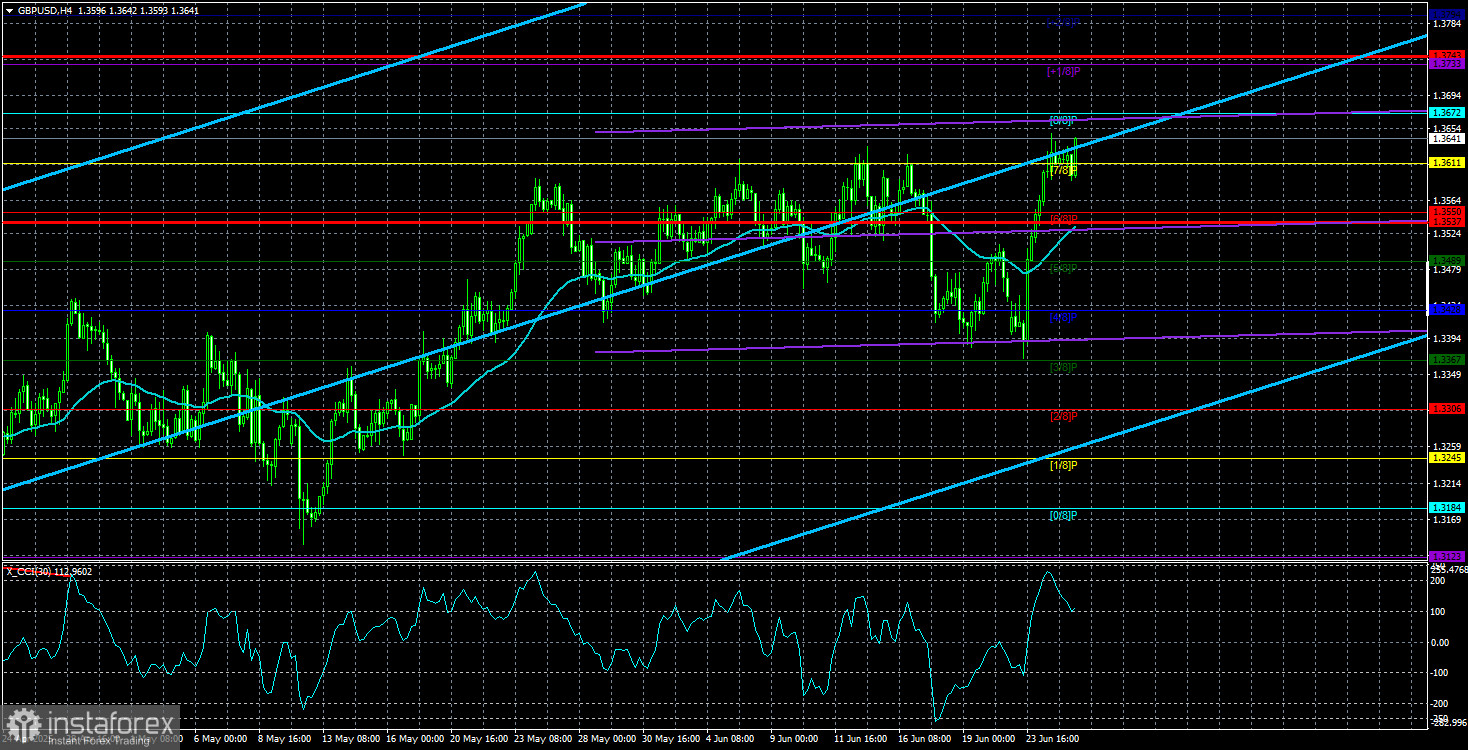
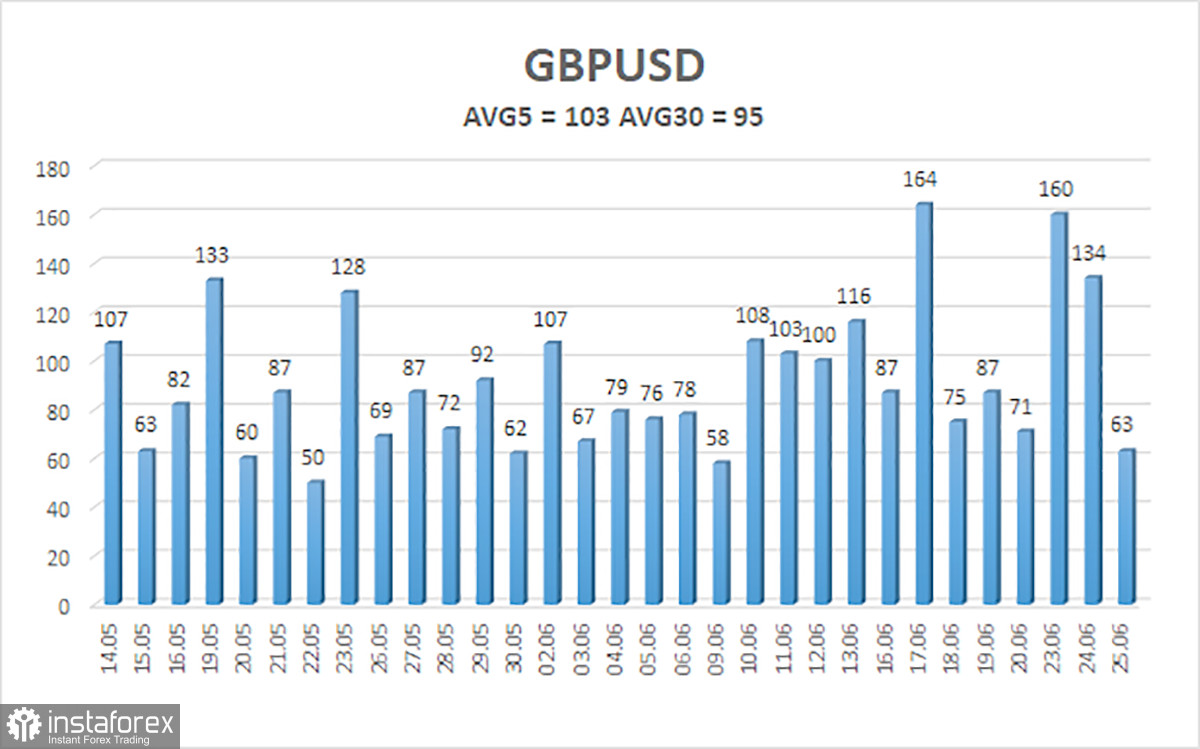
The average volatility of the GBP/USD pair over the past five trading days stands at 103 pips, which is considered "moderate" for this pair. On Thursday, June 26, we therefore expect movement within the range defined by the levels of 1.3537 to 1.3743. The long-term regression channel is pointing upward, indicating a clear uptrend. Last week, the CCI indicator entered the oversold area, which subsequently triggered the resumption of the upward trend.
Nearest Support Levels:
S1 – 1.3611
S2 – 1.3550
S3 – 1.3489
Nearest Resistance Levels:
R1 – 1.3672
R2 – 1.3733
R3 – 1.3794
Trading Recommendations:
The GBP/USD currency pair maintains its uptrend and has completed another minor correction. In the medium term, Trump's policies will likely continue putting pressure on the dollar. Therefore, long positions with targets at 1.3672 and 1.3733 remain relevant if the price is above the moving average. If the price falls below the moving average line, short positions may be considered with targets at 1.3489 and 1.3428, but—as before—strong dollar growth is not expected. The U.S. currency may occasionally exhibit corrective moves, but for sustained gains, evident signs of the end of the global trade war are needed.
Explanation of Illustrations:
Linear Regression Channels help determine the current trend. If both channels are aligned, it indicates a strong trend.
Moving Average Line (settings: 20,0, smoothed) defines the short-term trend and guides the trading direction.
Murray Levels act as target levels for movements and corrections.
Volatility Levels (red lines) represent the likely price range for the pair over the next 24 hours based on current volatility readings.
CCI Indicator: If it enters the oversold region (below -250) or overbought region (above +250), it signals an impending trend reversal in the opposite direction.