EUR/USD 5-Minute Analysis
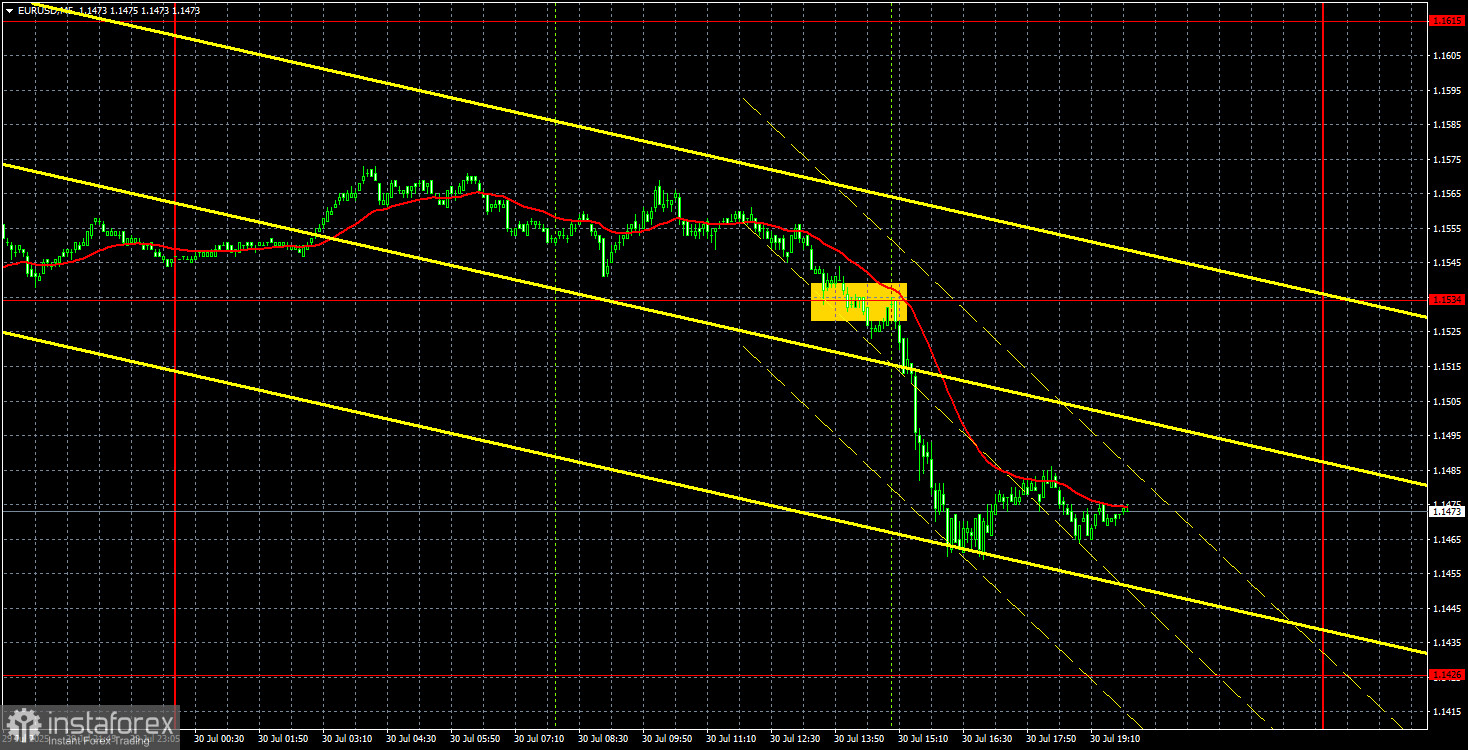
On Wednesday, the EUR/USD currency pair continued its downward movement. The decline in the euro and the rise in the dollar were essentially triggered by just one report, despite a rather full macroeconomic calendar. As is tradition, we will not be analyzing the outcomes of the FOMC meeting and the market movements that followed it in this article — those conclusions will be presented tomorrow.
On Wednesday, GDP reports from Germany and the Eurozone elicited little reaction from traders. These figures were neither clearly positive nor entirely negative. For instance, the German economy contracted by 0.1%, which was in line with forecasts, while the Eurozone economy grew by 0.1%, slightly exceeding traders' expectations. Overall, however, second-quarter growth was either stagnant or very modest — unlike the U.S. economy, which grew by 3% over the same period. It was precisely this U.S. report that triggered the strong appreciation of the dollar — and rightfully so.
Only one trading signal was generated yesterday. At the very start of the U.S. trading session, the pair broke through the 1.1534 level, allowing traders to open short positions. The price then dropped around 60 pips, and by evening, the trade could have been closed manually, as it was better to exit the market ahead of the FOMC meeting announcement — or at least set a Stop Loss to break even.
COT Report
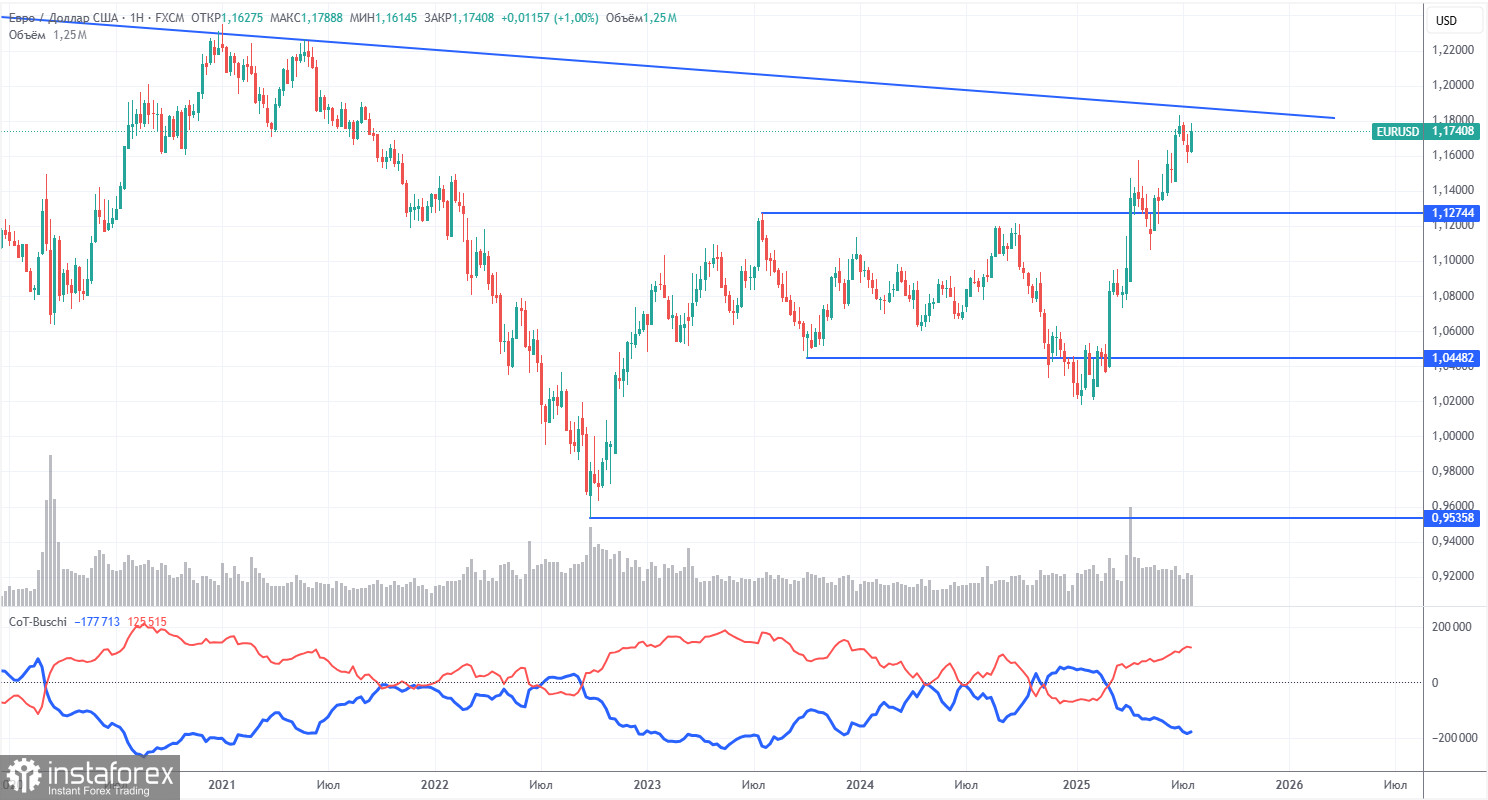
The latest COT (Commitment of Traders) report is dated July 22. As shown in the chart above, the net position of non-commercial traders was bullish for a long time. Bears barely took control at the end of 2024, but quickly lost it. Since Trump took office as President of the U.S., the dollar has only declined. While we can't say with 100% certainty that this decline will continue, current global developments suggest this scenario is likely.
We still see no fundamental factors supporting the euro, but one strong factor remains weighing on the U.S. dollar. The global downtrend remains intact, but what does it matter where the price has moved over the last 16 years? Once Trump ends his trade wars, the dollar may begin to rise — but when will that happen?
The position of the red and blue lines in the indicator continues to show a bullish trend. During the last reporting week, long positions held by the "Non-commercial" group increased by 6,200, while shorts increased by 8,900. Therefore, the net position decreased by 1,700 contracts — a negligible change.
EUR/USD 1-Hour Analysis
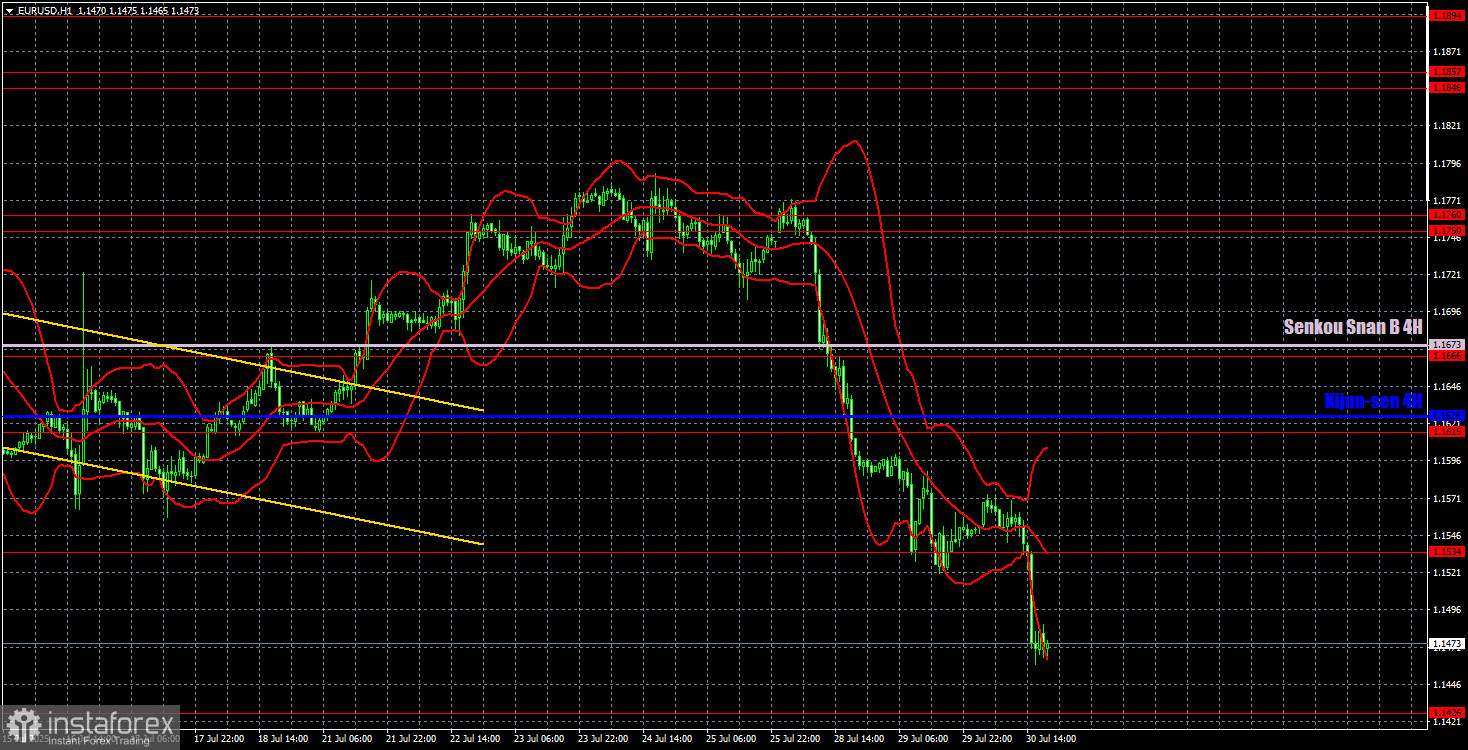
On the hourly chart, EUR/USD began to decline sharply and continues to fall, which is entirely logical this week. The agreement between Trump and the EU delivered a severe blow to the euro, but other macroeconomic data have also supported the dollar this week. With the help of a supportive local macro backdrop, the dollar may see further gains, although we still do not expect a medium-term rally. A correction is currently underway on the daily timeframe.
Trading levels for July 31 are as follows: 1.1092, 1.1147, 1.1185, 1.1234, 1.1274, 1.1362, 1.1426, 1.1534, 1.1615, 1.1666, 1.1750–1.1760, 1.1846–1.1857, as well as the Senkou Span B line (1.1673) and the Kijun-sen line (1.1626). The Ichimoku indicator lines may shift throughout the day, which should be taken into account when identifying trading signals. Don't forget to place a Stop Loss at breakeven once the price moves 15 pips in the right direction. This will protect against potential losses in case of a false signal.
On Thursday, unemployment and inflation data will be published in Germany. The Eurozone will release its unemployment rate, and in the U.S., the Core Personal Consumption Expenditures (PCE) Index and personal income and spending figures will be reported. Once again, there will be much news.
Trading Recommendations
A new decline in the market is quite possible today. However, let us remind you that macroeconomic data is now the main catalyst for dollar growth — primarily data from the U.S. Since no important reports will be published in the U.S. today, the euro may use this opportunity for a correction and recovery. Today will also bring a summary of the FOMC meeting.
Illustration Explanations:
- Support and resistance price levels – thick red lines where movement may end. They are not trading signal sources.
- Kijun-sen and Senkou Span B lines—These are strong Ichimoku indicator lines transferred to the hourly timeframe from the 4-hour one.
- Extremum levels – thin red lines where the price has previously rebounded. These act as trading signal sources.
- Yellow lines – trend lines, trend channels, and other technical patterns.
- COT Indicator 1 on the charts – the size of the net position for each category of traders.