GBP/USD 5-Minute Analysis
As we had warned, the GBP/USD currency pair also traded strongly on Monday. The U.S. dollar got off lightly, as the fall could have been much sharper. Traders witnessed a new round of escalation in the global trade war, a fresh wave of accusations from Trump toward China, and a weak ISM Manufacturing PMI, which is quite an important indicator. Naturally, against the backdrop of these events, no one paid the slightest attention to the UK Manufacturing PMI report. Nevertheless, it came in higher than expected, further supporting the pair's growth.
This week, important macroeconomic indicators are scheduled for release in the U.S., and expecting strong figures amidst the trade war is highly unlikely. Thus, by the end of the week, the U.S. currency could fall much further from current levels. Plus, let's not forget about Trump, who again "pleased" the market with new tariffs. As of Tuesday, it's fair to say the dollar has little chance for growth this week.
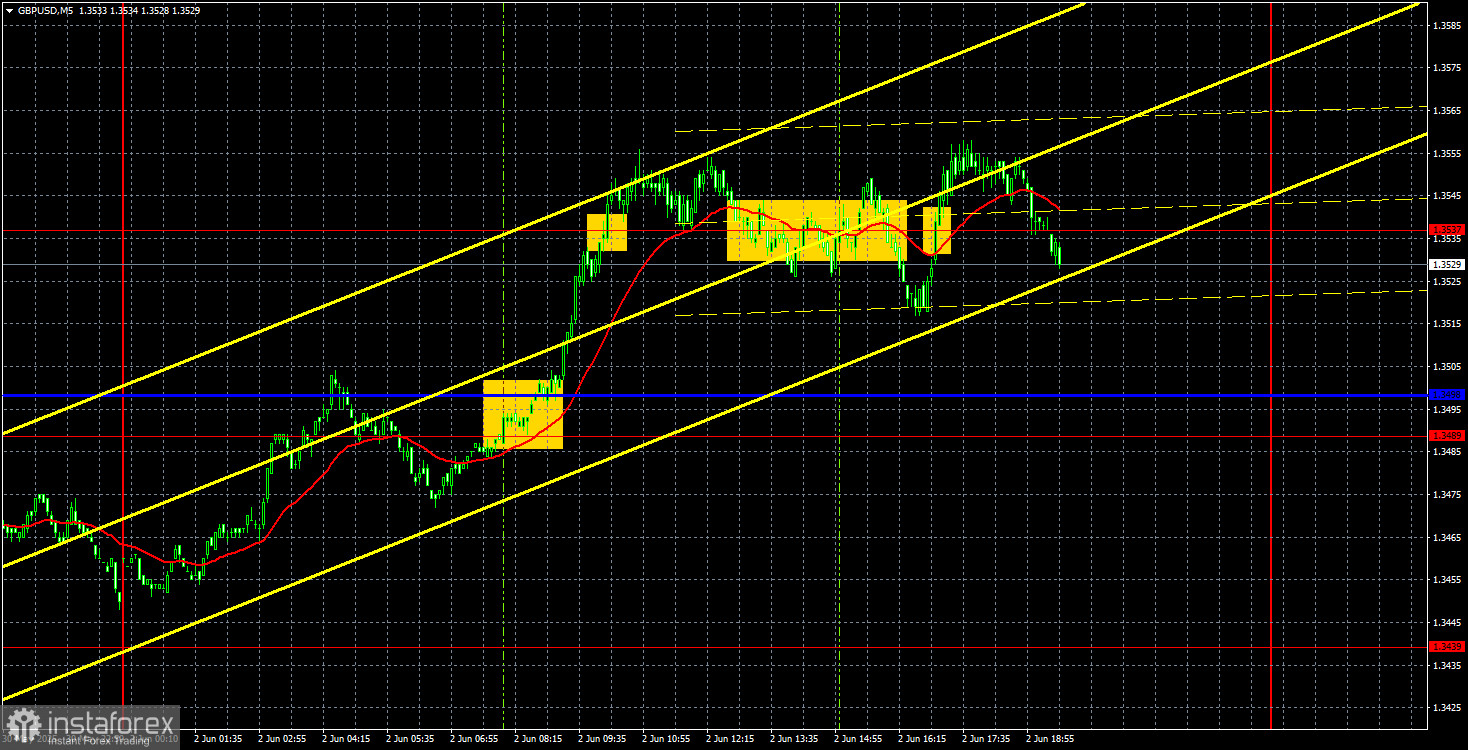
In the 5-minute timeframe, the pair formed quite a few trading signals, though not all were profitable or reliable. The first signal from breaking through the 1.3489-1.3498 range could have been successfully traded for a good profit. However, the price consolidated below the 1.3537 level during the U.S. session, signaling a sell. Therefore, longs should have been closed, and shorts opened — although the macro backdrop did not favor this move. However, the sell signal turned out to be false, and the final buy signal was a bit risky as it formed too late in the day.
COT Report
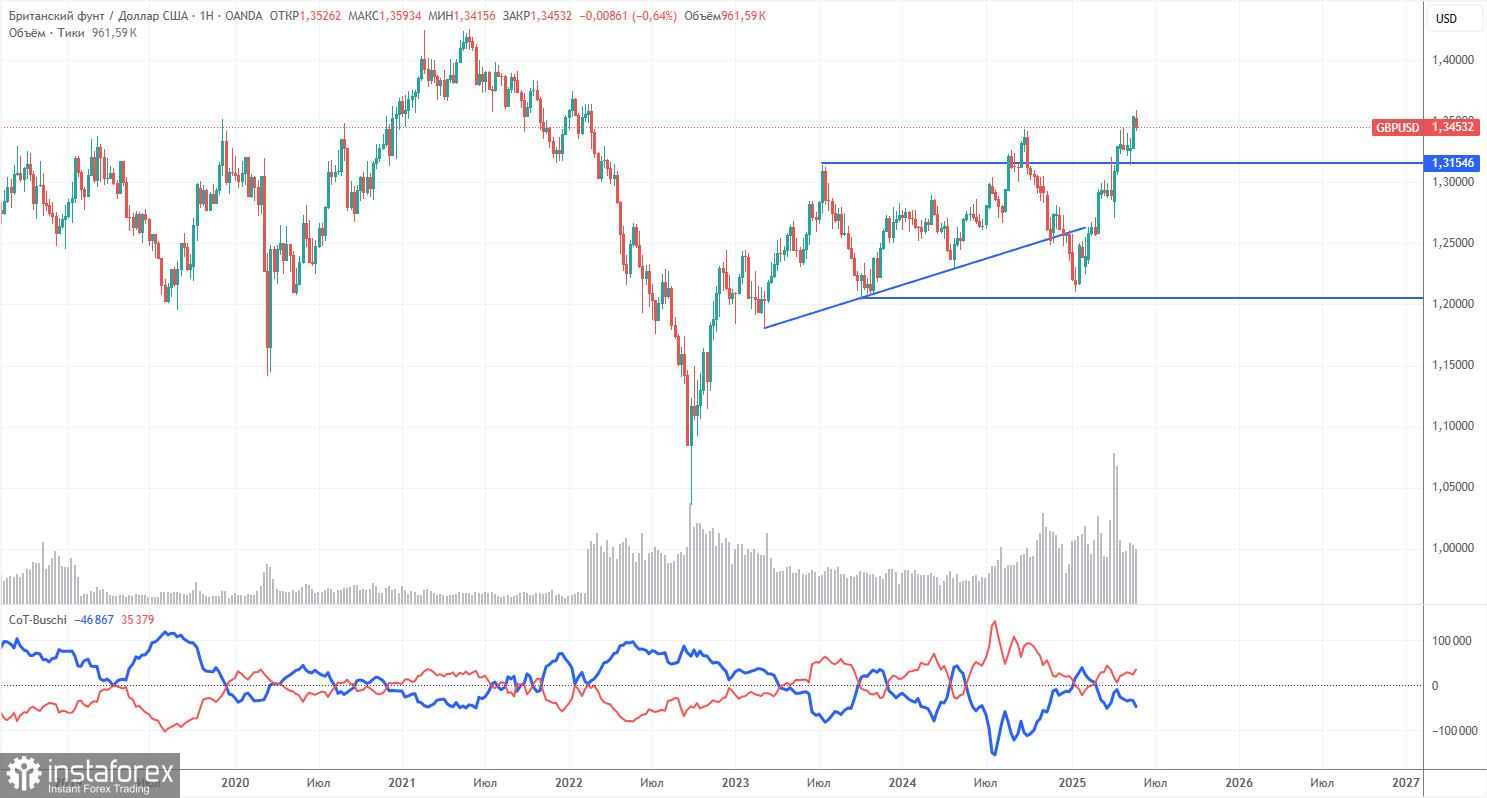
COT reports for the British pound show that commercial traders' sentiment has constantly changed over the past few years. The red and blue lines, representing the net positions of commercial and non-commercial traders, cross frequently and generally hover near the zero mark. They are again close to each other, indicating an approximately equal number of long and short positions. However, the net position has been growing over the past year and a half.
The dollar continues to decline due to Trump's policies, so market makers' demand for the pound is currently not of major importance. If the de-escalation of the global trade war resumes, the dollar may have a slight chance to strengthen. According to the latest COT report for the British pound, the "Non-commercial" group opened 14,200 BUY contracts and 2,800 SELL contracts. Thus, the net position of non-commercial traders grew by 11,400 contracts.
The pound has grown significantly lately, but it's important to understand that the main reason is Trump's policies. Once this reason is neutralized, the dollar could recover — but no one knows when that will happen. The pound itself has no fundamental reasons for growth. Nevertheless, traders currently have more than enough "Trump factor" to make trading decisions.
GBP/USD 1-Hour Analysis
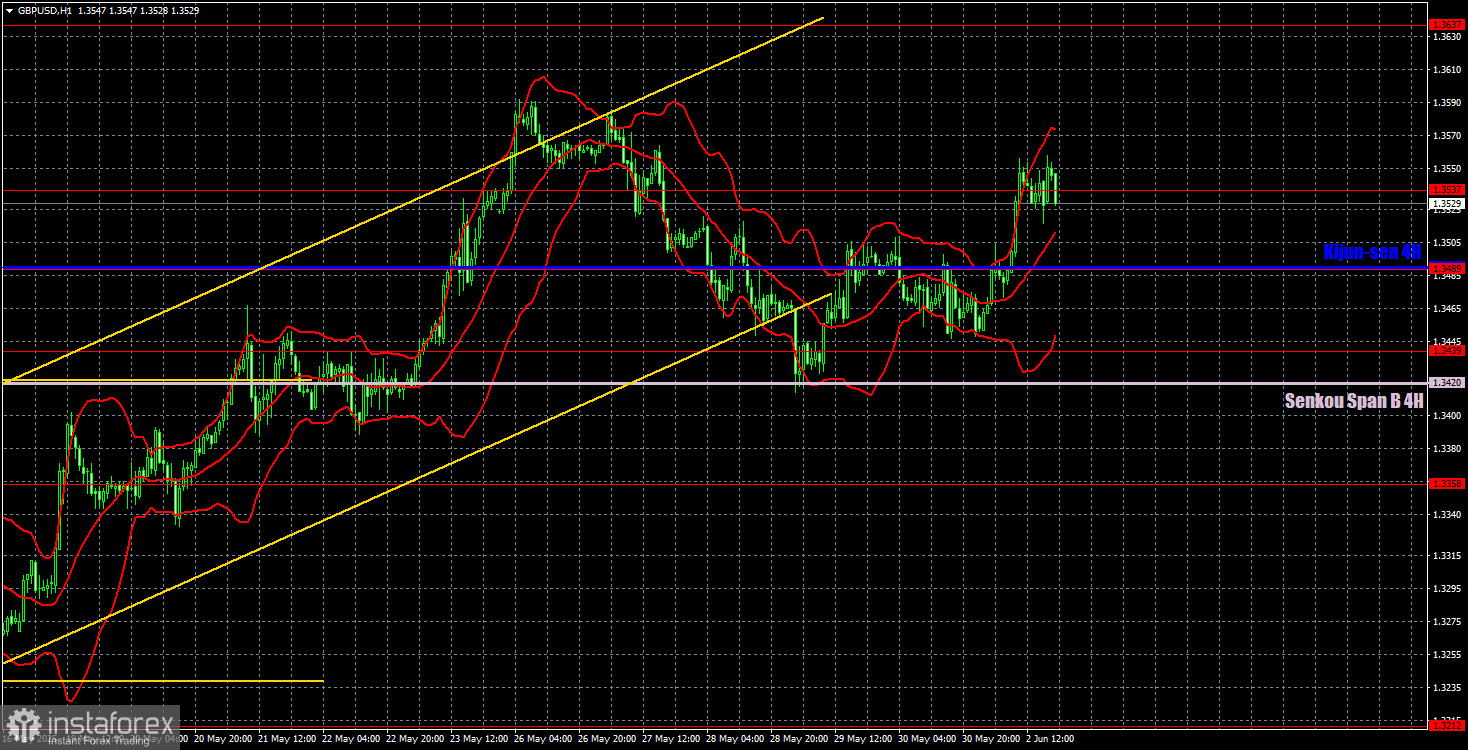
In the hourly timeframe, GBP/USD maintains its upward trend despite exiting the trend channel. Further movement of the pair entirely depends on Donald Trump and developments in the global trade war, not technical analysis. The general sentiment and attitude toward America and its president remain sharply negative, making it difficult for the dollar to rally strongly. Moreover, the U.S. president regularly disappoints the market with new measures and tariffs, while macroeconomic data from across the Atlantic continues to come in weak.
For June 3, the important levels are 1.2863, 1.2981-1.2987, 1.3050, 1.3125, 1.3212, 1.3288, 1.3358, 1.3439, 1.3489, 1.3537, 1.3637-1.3667, and 1.3741. The Senkou Span B line (1.3420) and Kijun-sen line (1.3490) can also be sources of signals. Setting a Stop Loss at break-even is recommended if the price moves 20 pips in the right direction. Ichimoku indicator lines can shift during the day, so this should be considered when determining trading signals.
No important events or releases are scheduled for Tuesday in the UK; in the U.S., only the JOLTs Job Openings report will be released. Keep in mind that this report is published with a two-month lag and is not considered important. The market already has plenty of news to trade on.
Illustration Explanations:
- Support and resistance price levels – thick red lines where movement may end. They are not trading signal sources.
- Kijun-sen and Senkou Span B lines—These are strong Ichimoku indicator lines transferred to the hourly timeframe from the 4-hour one.
- Extremum levels – thin red lines where the price has previously rebounded. These act as trading signal sources.
- Yellow lines – trend lines, trend channels, and other technical patterns.
- COT Indicator 1 on the charts – the size of the net position for each category of traders.