Analysis of Friday's Trades
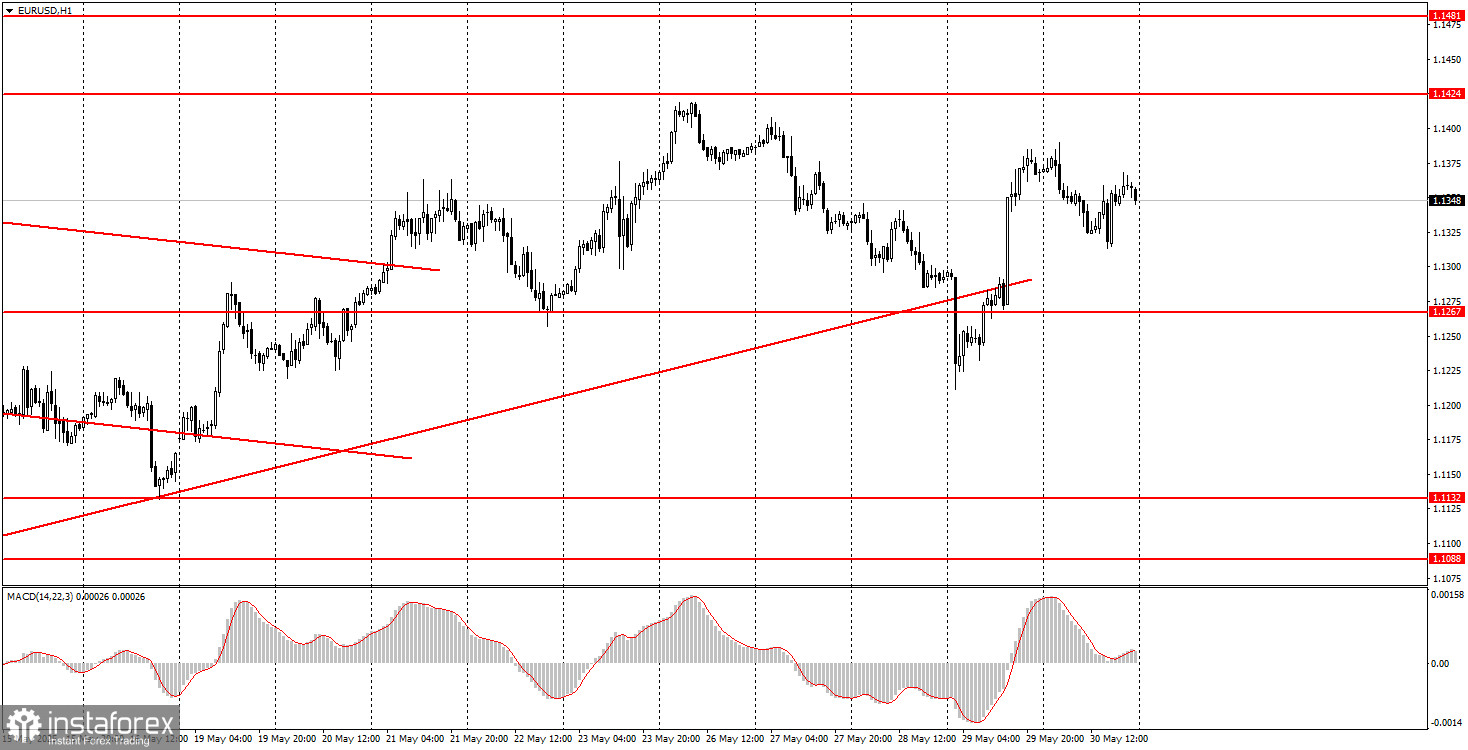
1H Chart of EUR/USD
The EUR/USD currency pair traded more calmly on Friday than on Thursday. This is not surprising, as the macroeconomic background was weak, and the market had digested all the information from Thursday about the court's cancellation of Trump's tariffs and the 14-day suspension of that decision. Recall that the court initially blocked Trump's tariffs on Thursday, citing their illegality, but later postponed its decision. As a result, the dollar first rose confidently, then showed a threefold stronger decline. On Friday, the market corrected, and now the EUR/USD pair remains near its highs, maintaining prospects for an uptrend. Also on Friday, Germany released a "dull" inflation report: the consumer price index (CPI) stood at 2.1% in May. Traders had expected CPI to fall to 2%, but that didn't happen. In any case, inflation currently has almost no impact on the European Central Bank's monetary policy.
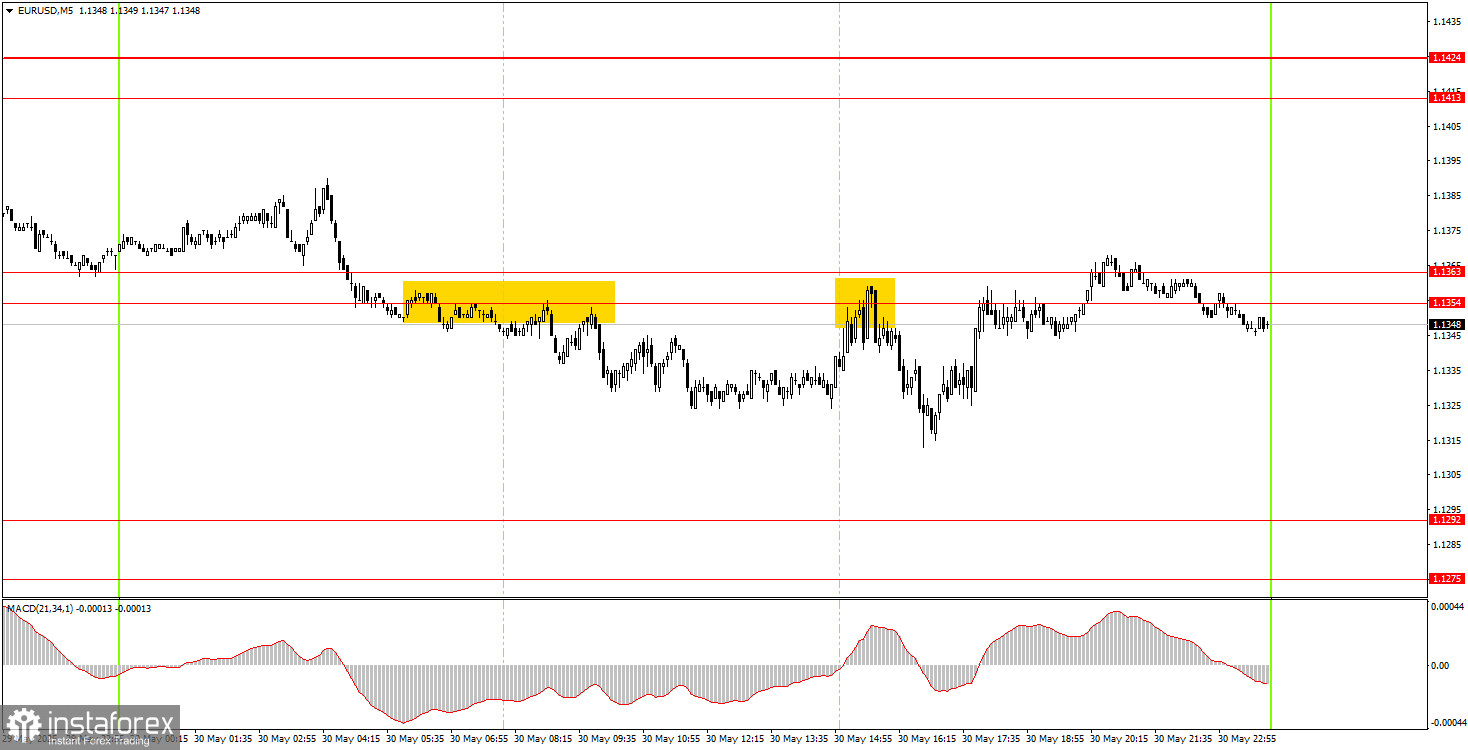
5M Chart of EUR/USD
On the 5-minute timeframe, two trading signals were formed on Friday. Since the movement during the day was more sideways than trending, the signals were not the best. Nevertheless, the price first broke through the 1.1354–1.1363 area and then bounced off the same area at the start of the U.S. trading session. Thus, novice traders could have opened two short positions. Unfortunately, the pair did not reach the nearest target level in either case but moved at least 15 pips in the right direction both times. Neither of the opened trades could have closed at a loss.
Trading Strategy for Monday:
In the hourly timeframe, the EUR/USD pair broke the ascending trend line; however, the uptrend that began under Donald Trump could very well continue. Essentially, the fact that Trump is president is enough reason for the market to keep selling the dollar without looking back. If Trump starts issuing threats, ultimatums, and imposing/raising tariffs again, the market will have few options. Failing to cancel Trump's tariffs means the trade war situation remains unchanged.
On Monday, the EUR/USD pair may resume its downward correction since the trend line has been breached. At the same time, it's important to remember that the dollar has no strong reasons for significant growth.
For the 5-minute timeframe, consider the following levels: 1.0940–1.0952, 1.1011, 1.1088, 1.1132–1.1140, 1.1198–1.1218, 1.1267–1.1292, 1.1354–1.1363, 1.1413–1.1424, 1.1474–1.1481, 1.1513, 1.1548, 1.1571, 1.1607–1.1622. On Monday, manufacturing sector business activity indices are scheduled for release in Germany, the Eurozone, and the U.S. It is important to closely monitor the ISM index in the U.S..
Core Trading System Rules:
- Signal Strength: The shorter the time it takes for a signal to form (a rebound or breakout), the stronger the signal.
- False Signals: If two or more trades near a level result in false signals, subsequent signals from that level should be ignored.
- Flat Markets: In flat conditions, pairs may generate many false signals or none at all. It's better to stop trading at the first signs of a flat market.
- Trading Hours: Open trades between the start of the European session and the middle of the US session, then manually close all trades.
- MACD Signals: On the hourly timeframe, trade MACD signals only during periods of good volatility and a clear trend confirmed by trendlines or trend channels.
- Close Levels: If two levels are too close (5–20 pips apart), treat them as a support or resistance zone.
- Stop Loss: Set a Stop Loss to breakeven after the price moves 15 pips in the desired direction.
Key Chart Elements:
Support and Resistance Levels: These are target levels for opening or closing positions and can also serve as points for placing Take Profit orders.
Red Lines: Channels or trendlines indicating the current trend and the preferred direction for trading.
MACD Indicator (14,22,3): A histogram and signal line used as a supplementary source of trading signals.
Important Events and Reports: Found in the economic calendar, these can heavily influence price movements. Exercise caution or exit the market during their release to avoid sharp reversals.
Forex trading beginners should remember that not every trade will be profitable. Developing a clear strategy and practicing proper money management are essential for long-term trading success.