On Wednesday, the GBP/USD currency pair traded with a slight decline, but it's hard to believe in further strengthening the U.S. dollar under the current circumstances. On the one hand, the dollar has significantly depreciated in recent months, so it wouldn't be surprising if a deeper correction starts now driven by technical factors. On the other hand, is there any real reason to believe that the dollar's collapse due to the "Trump factor" is over and that the U.S. president will no longer shock the markets?
Let's recall that Trump follows a "stick method." It's known as the "carrot and stick" method for many others, but the U.S. president appears to omit the carrot. He demands certain things, and if they are not granted, he imposes tariffs, sanctions, etc. Negotiations with the European Union are likely to be conducted "at gunpoint." Brussels has taken the first step toward talks, but if Washington's terms are draconian, can we expect a deal to be signed?
The same applies to China. Beijing and Washington agreed to reduce tariffs by 115%, though this was not part of structured negotiations. It was more of an emergency measure to salvage trade between the world's two largest economies.
We believe that what we are currently experiencing is a technical correction. It's unlikely the market suddenly decided to believe Trump, who just yesterday claimed that beneficial deals with China and the EU will be signed and that these countries are headed for a bright future. Frankly, all these grandiose statements are becoming tedious, as they essentially mean nothing. The market wants to operate on facts and specifics. If negotiations are taking place, it wants to know how they're progressing. If not, it wants to know why. However, such information is absent in the media.
This is why we remain highly skeptical of Trump's overly optimistic announcements and the current strengthening of the dollar. Only two trading days are left in the week, and no significant macroeconomic releases are scheduled. Thus, the dollar will still struggle to find motivation for growth. Today's second GDP estimate for the first quarter in the U.S. will likely disappoint, just like the first estimate. On Friday, the core PCE index will be released, but what relevance does it hold if the Federal Reserve pays no attention to current inflation, waiting instead for a sharp acceleration?
The U.K.'s fundamental background is even less relevant to traders than the Federal Reserve or Bank of England positions. Recall that at its last meeting, the BOE cut the key rate, while the Fed left it unchanged and did not even hint at potential easing in the future. Therefore, the dollar has had ample reason to rise over the past few months. Yet, it hasn't because the market continues to focus solely on the state of the trade war initiated by Trump.
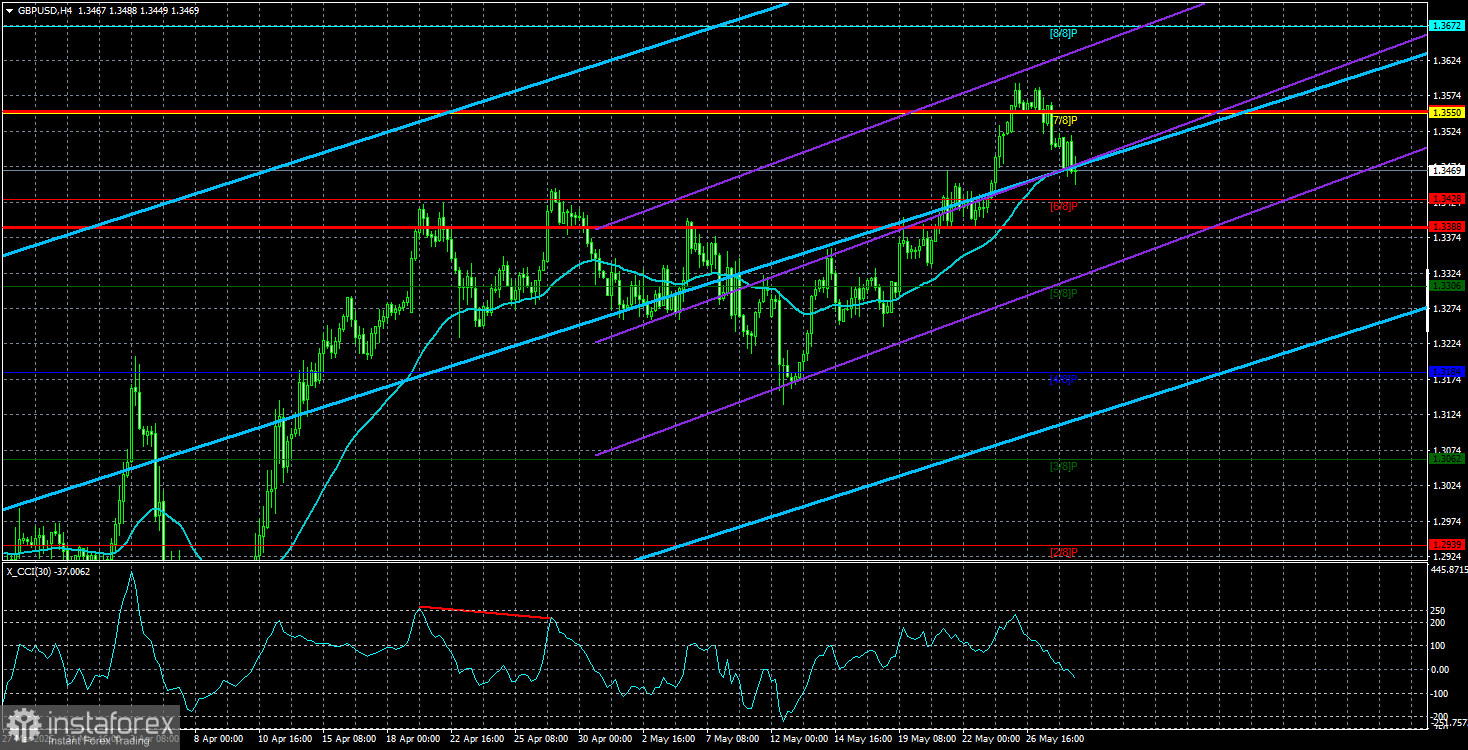
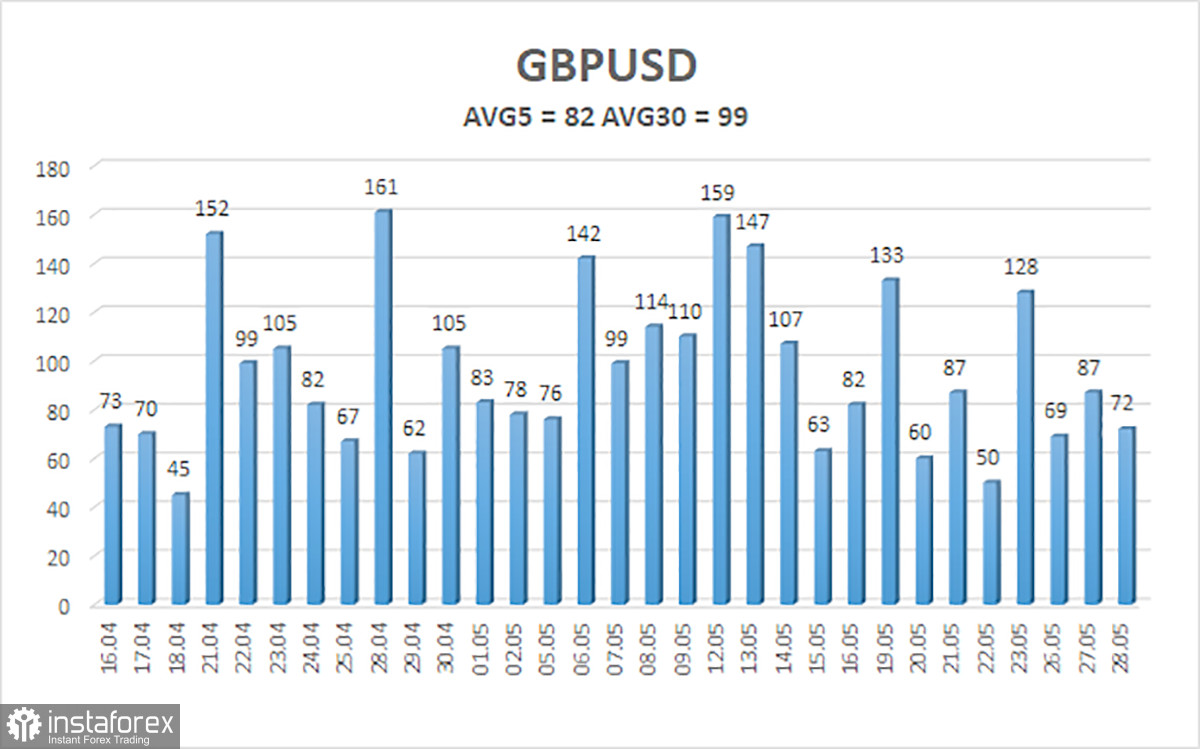
The average volatility of the GBP/USD pair over the last five trading days is 82 pips, which is classified as "moderate." On Thursday, May 29, we expect movement within a range bounded by levels 1.3388 and 1.3552. The long-term regression channel points upward, indicating a clear uptrend. The CCI indicator has not recently entered extreme zones.
Nearest Support Levels:
S1 – 1.3428
S2 – 1.3306
S3 – 1.3184
Nearest Resistance Levels:
R1 – 1.3550
R2 – 1.3672
R3 – 1.3794
Trading Recommendations:
The GBP/USD currency pair maintains an upward trend and continues to rise regardless of external conditions. The de-escalation of the trade conflict ended as quickly as it began, and the market's aversion to the dollar persisted. Every new decision by Trump is interpreted negatively by the market. Therefore, long positions remain possible with targets at 1.3550 and 1.3552 if the price stays above the moving average. A break below the moving average would make short positions relevant, with targets at 1.3388 and 1.3306. The U.S. currency may occasionally show minor corrections, but a more substantial rally would require new signs of real progress in de-escalating the global trade war.
Explanation of Illustrations:
Linear Regression Channels help determine the current trend. If both channels are aligned, it indicates a strong trend.
Moving Average Line (settings: 20,0, smoothed) defines the short-term trend and guides the trading direction.
Murray Levels act as target levels for movements and corrections.
Volatility Levels (red lines) represent the likely price range for the pair over the next 24 hours based on current volatility readings.
CCI Indicator: If it enters the oversold region (below -250) or overbought region (above +250), it signals an impending trend reversal in the opposite direction.