Analysis of Tuesday's Trades
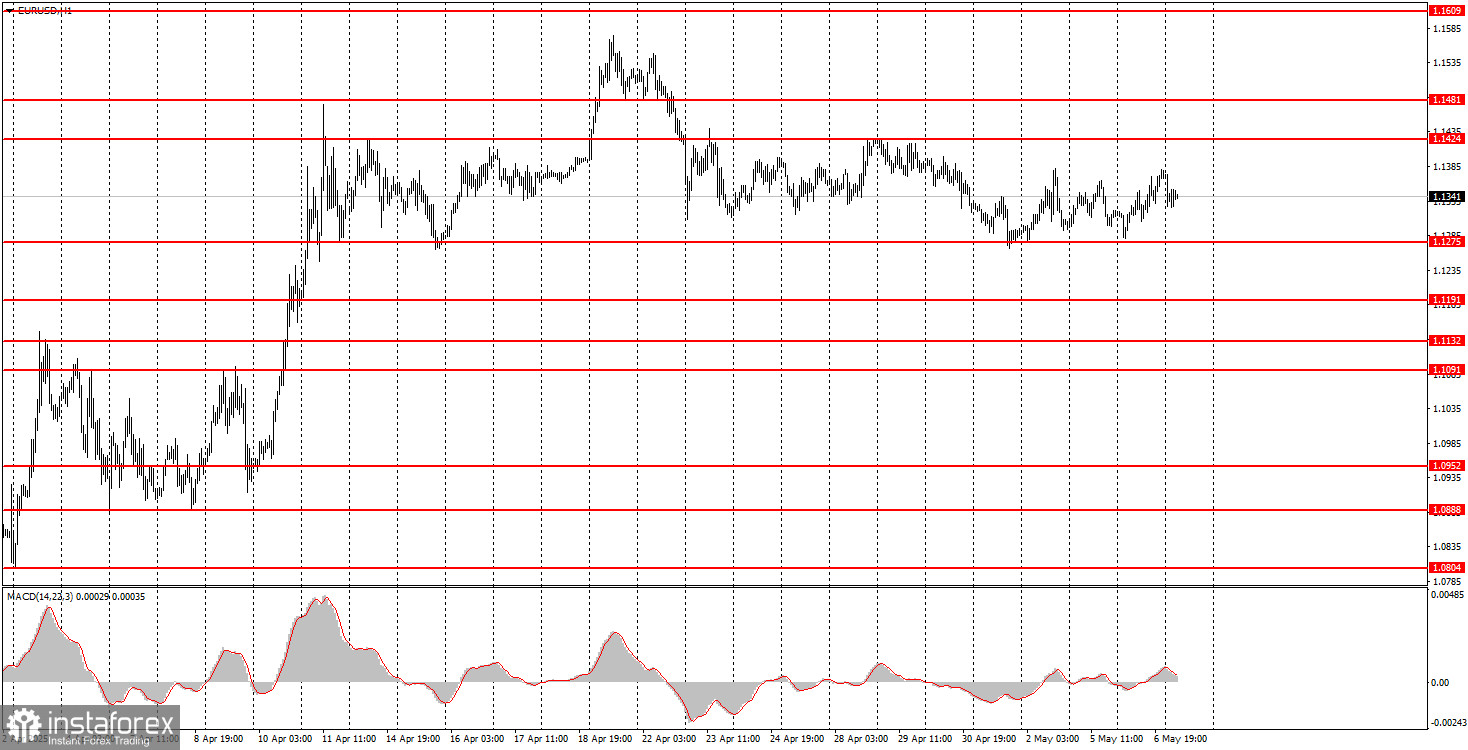
1H Chart of EUR/USD
On Tuesday, the EUR/USD currency pair traded completely flat. Throughout the day, there were no significant reports or events either in the Eurozone or in the U.S., so there was virtually no chance for the flat movement to end. The only hope rested on Donald Trump introducing new tariffs or making another high-impact decision. However, Trump has refrained from escalating the trade conflict for the past three weeks and is currently looking for ways to pressure China and the European Union into signing trade agreements on his terms. As a result, there are no new reasons for the dollar to fall, but also few reasons for it to rise, given that the market continues to ignore about 90% of macroeconomic data. This evening, the results of the upcoming Federal Reserve meeting will be announced, but there is no intrigue here — the interest rate will remain unchanged. Only the press conference may bring market-moving commentary that could defy expectations.
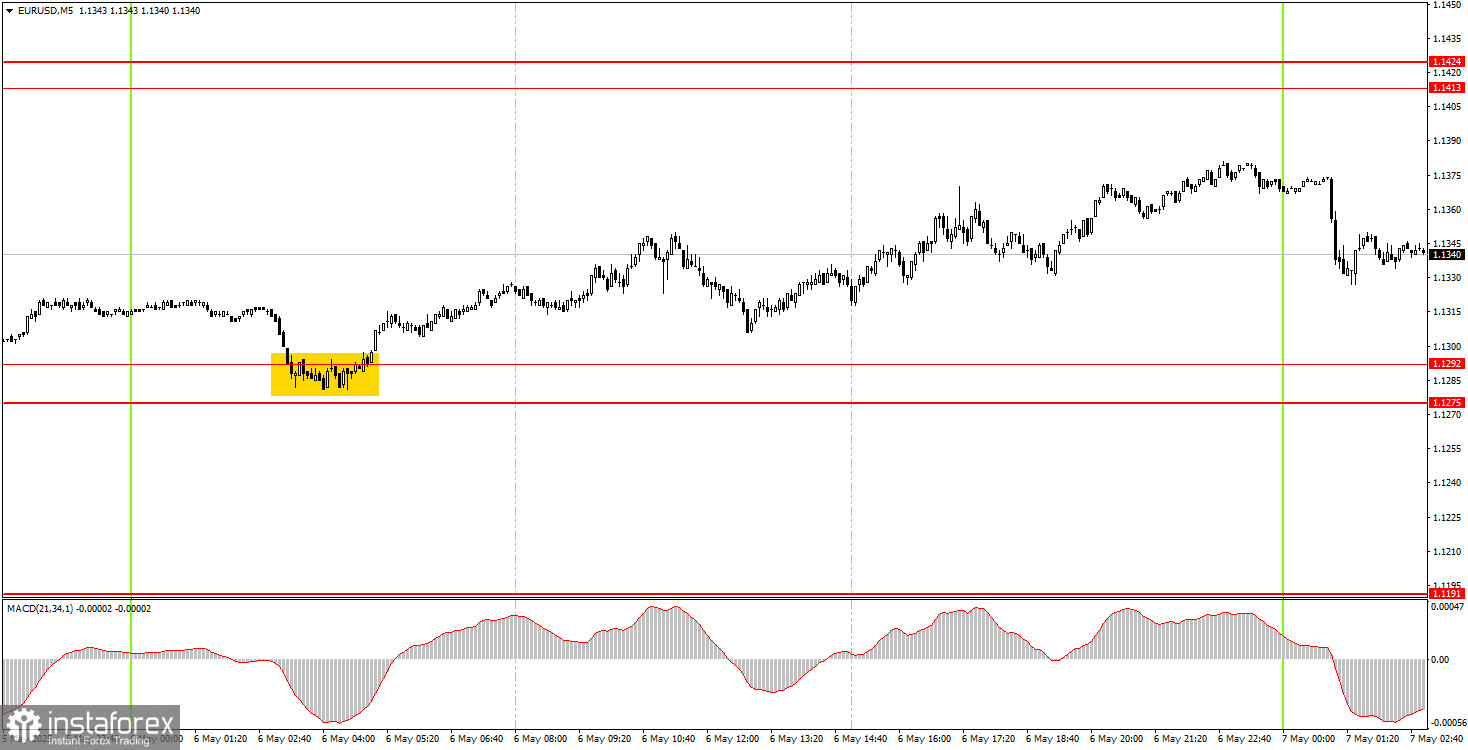
5M Chart of EUR/USD
Only one trading signal was formed on Tuesday on the 5-minute timeframe, and that happened overnight. The price rebounded from the lower boundary of the sideways channel, which on the 5-minute chart is defined by the 1.1275–1.1292 area. After that, the price moved upward throughout the day, but since the signal occurred during the night, few traders could act on it.
Trading Strategy for Wednesday:
On the hourly timeframe, EUR/USD maintains a bullish trend. At the same time, the market has been in a sideways range near its highs for three weeks. Overall, market sentiment remains negative toward the U.S. dollar, but if Trump shifts toward de-escalating the trade conflict, which he initiated, the dollar may strengthen. It is uncertain when or if that will happen.
On Wednesday, the pair may move again in either direction, as market movements still largely depend on Trump's statements and decisions. Since there have been few recent developments from Trump, we believe the flat trend will likely persist. The bounce from the lower boundary of the flat range (1.1275) triggered the pair's upward movement, but the Fed meeting is scheduled for the evening.
On the 5-minute timeframe, consider the following levels for trading: 1.0940–1.0952, 1.1011, 1.1091, 1.1132–1.1140, 1.1189–1.1191, 1.1275–1.1292, 1.1413–1.1424, 1.1474–1.1481, 1.1513, 1.1548, 1.1571, 1.1607–1.1622, 1.1666, 1.1689. In the Eurozone, only retail sales data will be published on Wednesday, unlikely to trigger a noticeable market reaction. In the U.S., the results of the Fed meeting will be announced, but the market's reaction may be quite muted. We expect the flat trend to continue today as well.
Core Trading System Rules:
- Signal Strength: The shorter the time it takes for a signal to form (a rebound or breakout), the stronger the signal.
- False Signals: If two or more trades near a level result in false signals, subsequent signals from that level should be ignored.
- Flat Markets: In flat conditions, pairs may generate many false signals or none at all. It's better to stop trading at the first signs of a flat market.
- Trading Hours: Open trades between the start of the European session and the middle of the US session, then manually close all trades.
- MACD Signals: On the hourly timeframe, trade MACD signals only during periods of good volatility and a clear trend confirmed by trendlines or trend channels.
- Close Levels: If two levels are too close (5–20 pips apart), treat them as a support or resistance zone.
- Stop Loss: Set a Stop Loss to breakeven after the price moves 15 pips in the desired direction.
Key Chart Elements:
Support and Resistance Levels: These are target levels for opening or closing positions and can also serve as points for placing Take Profit orders.
Red Lines: Channels or trendlines indicating the current trend and the preferred direction for trading.
MACD Indicator (14,22,3): A histogram and signal line used as a supplementary source of trading signals.
Important Events and Reports: Found in the economic calendar, these can heavily influence price movements. Exercise caution or exit the market during their release to avoid sharp reversals.
Forex trading beginners should remember that not every trade will be profitable. Developing a clear strategy and practicing proper money management are essential for long-term trading success.