The EUR/USD currency pair continued to trade strictly sideways on Tuesday. The broader flat market has now lasted for nearly a month, and in addition to that, the market seems to have formed another, narrower sideways channel visible on the hourly time frame. In other words, we're now witnessing a flat within a flat — a total standstill. Last week, even a slew of key U.S. data couldn't help traders start a new trend, and there haven't been any significant developments this week. However, there are a few points worth highlighting.
First, the new trading week began with fresh tariffs introduced by Donald Trump. This time, the consensus is that he has targeted the domestic film industry. It's no secret that most of the world's film production centers in the U.S., but much of the filming happens abroad for economic reasons. Trump decided to "fix" this. Now, any film shot outside the United States will be subject to a 100% import tax. In our view, these tariffs are not as large-scale or impactful as those on automobile or steel imports, or those targeting specific countries. If Trump wants to damage his own film industry, that's his prerogative. However, these new tariffs make one thing clear: Trump's policy direction has not changed, despite his three-week pause.
Second, we'll get the Federal Reserve's policy meeting results this evening. Although the outcome is essentially known — Powell has repeatedly stressed there is no rush to ease monetary policy — the market could still start trading more actively. What can we expect from the Fed and Powell this evening? Either Powell's rhetoric remains unchanged, which would not inspire confidence in dollar buyers, or his tone turns more dovish, giving the market a fresh reason to sell the dollar. In either case, a rate hike is not on the table, and the U.S. dollar has already fallen hard even when the European Central Bank was cutting rates and the Fed was holding steady.
Therefore, the most likely outcome this evening is that the dollar either declines or holds its ground, but not more than that. Of course, we must acknowledge that anything is possible in the FX market. Last week is a perfect example: despite a flood of disappointing U.S. macroeconomic data, the dollar grew for four straight days. Logic and consistency remain in short supply, so even a dollar rally on dovish remarks from Powell is not impossible. Still, we base our forecasts on logic, fundamentals, and macroeconomics. How can one reasonably forecast dollar strength if the Fed may soften its stance? Regardless, the dollar has not appreciated enough in recent weeks to claim that a downtrend in EUR/USD has begun.
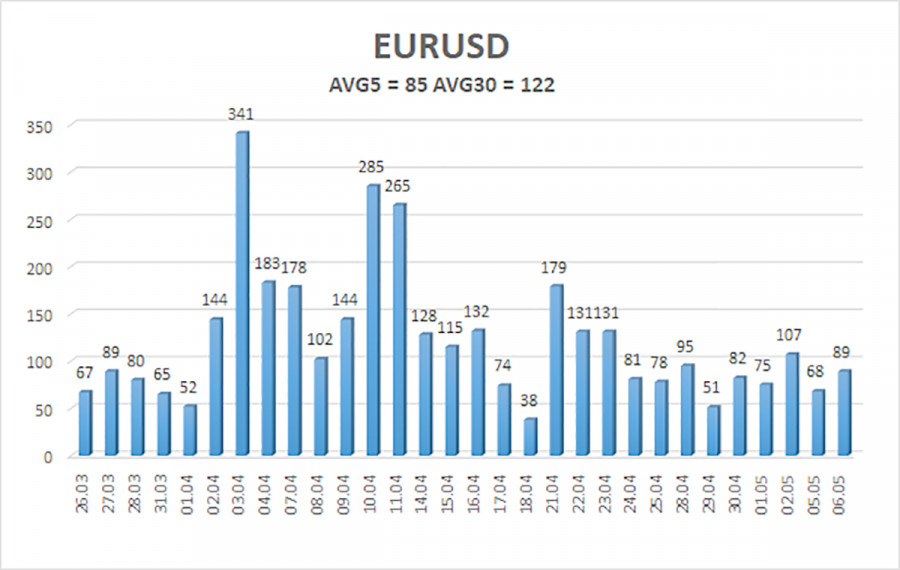
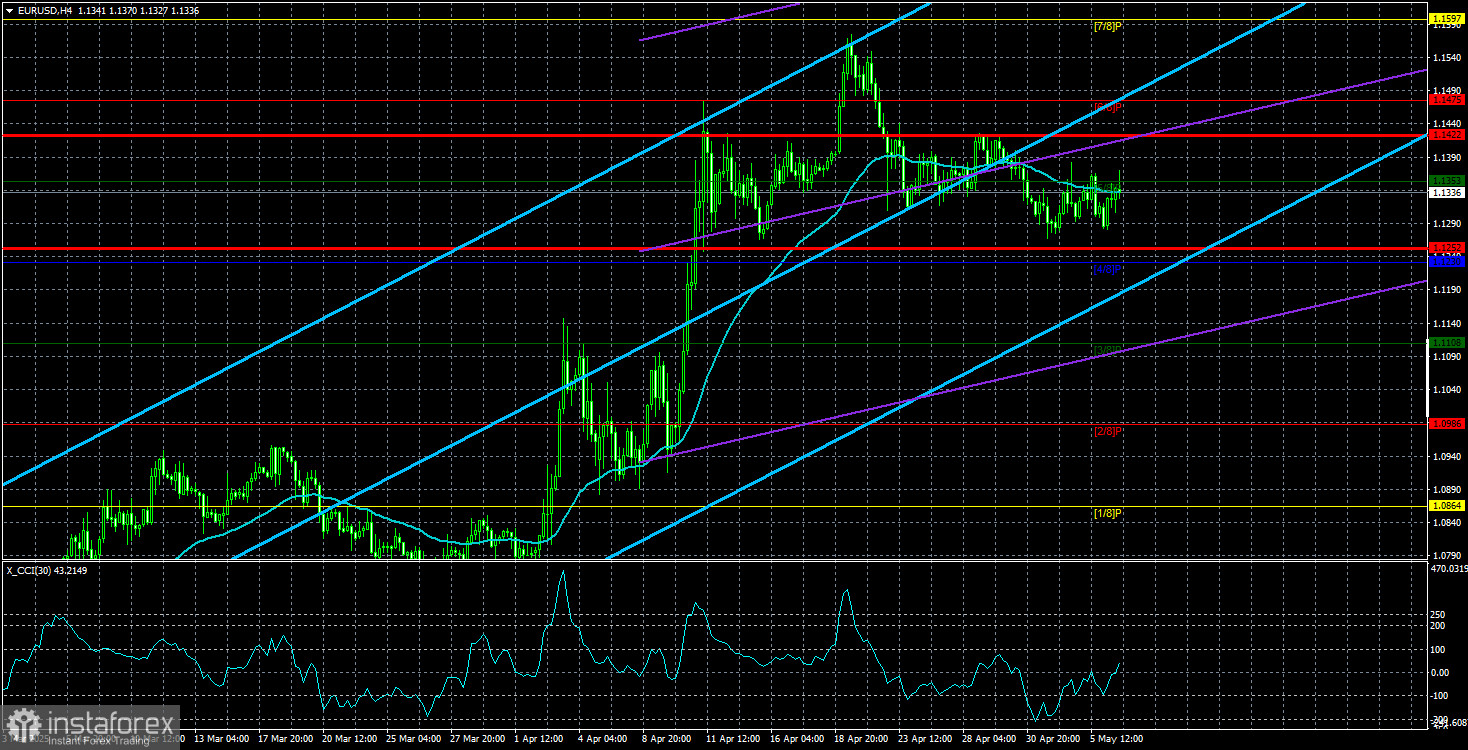
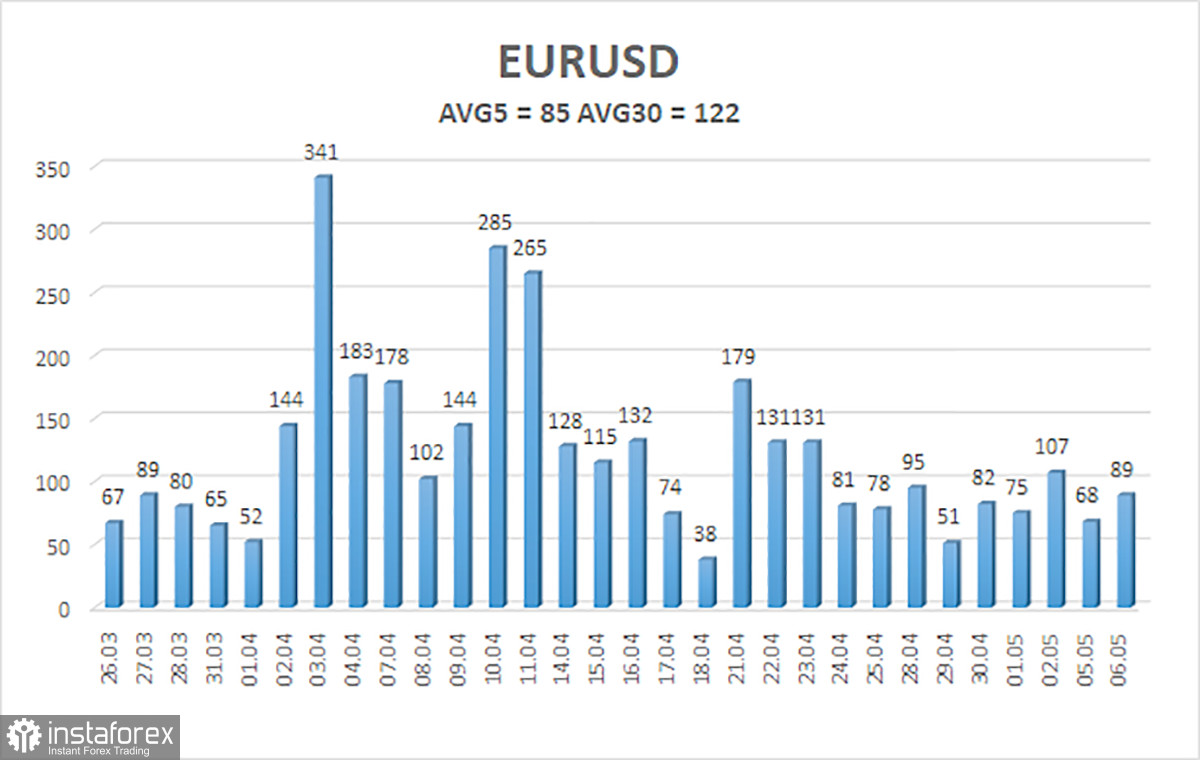
The average volatility for the EUR/USD pair over the past five trading days as of May 7 is 85 points, which is considered "average." We expect the pair to move between 1.1252 and 1.1422 on Wednesday. The long-term regression channel remains upward-sloping, indicating a continued short-term bullish trend. The CCI indicator has entered the overbought zone thrice, resulting in only a minor correction.
Nearest Support Levels:
S1: 1.1230
S2: 1.1108
S3: 1.0986
Nearest Resistance Levels:
R1: 1.1353
R2: 1.1475
R3: 1.1597
Trading Recommendations:
EUR/USD has started a new leg of downward correction within the broader uptrend. For months, we've consistently stated that we expect the euro to decline in the medium term, and that view hasn't changed. The U.S. dollar still lacks fundamental reasons to fall further, except for Trump. However, this single factor may continue pushing the dollar lower, especially since the market keeps ignoring all others. If you trade based on pure technicals or "Trump factor," then long positions remain relevant while the price stays above the moving average, with a target of 1.1475. Short positions targeting 1.1230 and 1.1227 become more appropriate if the price drops below the moving average. For the past three weeks, the market has been completely rangebound.
Explanation of Illustrations:
Linear Regression Channels help determine the current trend. If both channels are aligned, it indicates a strong trend.
Moving Average Line (settings: 20,0, smoothed) defines the short-term trend and guides the trading direction.
Murray Levels act as target levels for movements and corrections.
Volatility Levels (red lines) represent the likely price range for the pair over the next 24 hours based on current volatility readings.
CCI Indicator: If it enters the oversold region (below -250) or overbought region (above +250), it signals an impending trend reversal in the opposite direction.