The GBP/USD currency pair also continued its upward movement in Monday's trading, even though volatility was fairly low. Throughout Monday, traders received no significant macroeconomic or fundamental news, so the sluggish market activity is quite understandable. At the same time, last Friday and the previous week provided plenty of food for thought. Over recent weeks, we've grown tired of repeating the same thing—there is simply no reason for the dollar to rise. Of course, that doesn't mean the dollar cannot rise by definition. It just means there are no grounds for it to do so.
As always, the problem lies with the big players—market makers who, thanks to their capital, can manipulate the market, hunt for retail traders' liquidity, and move prices against the broader market direction. For example, we are convinced that last Tuesday's crash in the British pound was pure manipulation, as we discussed several times last week. What happened? GBP/USD was trading calmly, only to then suddenly crash 200 pips lower for no apparent reason. Of course, a "reason" was quickly found—the yield on UK government bonds reached its highest level since 1998. But one has to ask, does the market think that a bond yield of 5.6% is okay (since at that value the pound had no problems), but 5.7% is suddenly too much? Bond yields don't rise to 5.7% overnight!
This crash in the British pound only showed us that a new wave of the uptrend is inevitable. The fundamental backdrop remains disastrous for the dollar, and by the way, the yield on US Treasuries is rising steadily too, creating extra strain on the budget. US labor market and unemployment data, in essence, put an end to any hopes for the dollar's growth, even a slight one. Nonfarm Payrolls for the fourth consecutive month came in at very low values, unemployment is rising, and this week we are almost sure to see an uptick in US inflation for August.
Recall that rising inflation is more of a bullish factor for the dollar, as the Federal Reserve is then not supposed to cut the key rate—otherwise, that would trigger even higher inflation. But how are they supposed to save the jobs market then? The answer is simple: they have to choose either to save the jobs market or continue fighting high inflation, which will keep rising due to Donald Trump's trade war. Therefore, another rise in inflation is unlikely to save the dollar from falling.
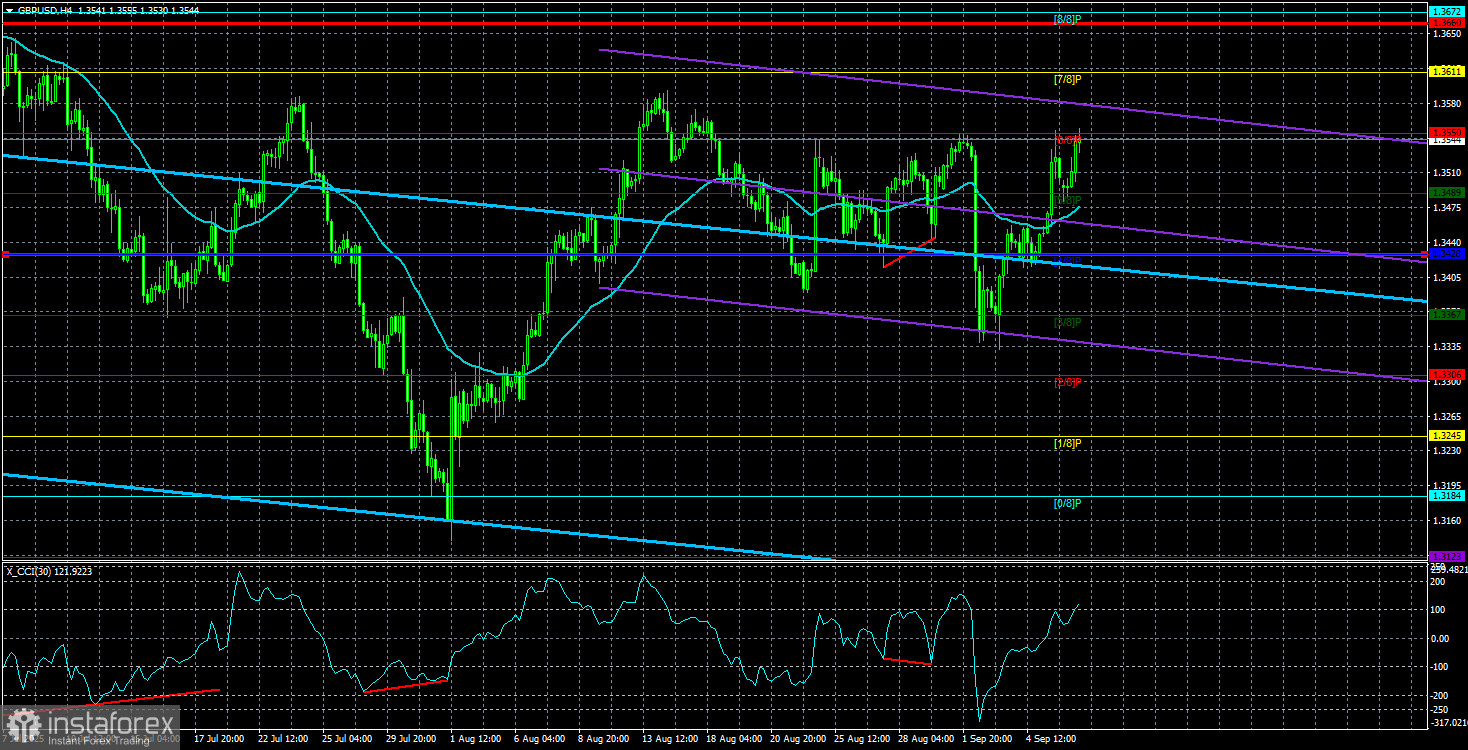
On the daily timeframe, it's clear that the pair corrected for precisely one month, managing a perfect 38.2% Fibonacci retracement. A new wave of growth began on August 1. In recent weeks, the price has remained relatively stable, mainly due to the market's anticipation of the Nonfarm Payrolls report. On Friday, those hopes were dashed, so selling the US dollar can continue.
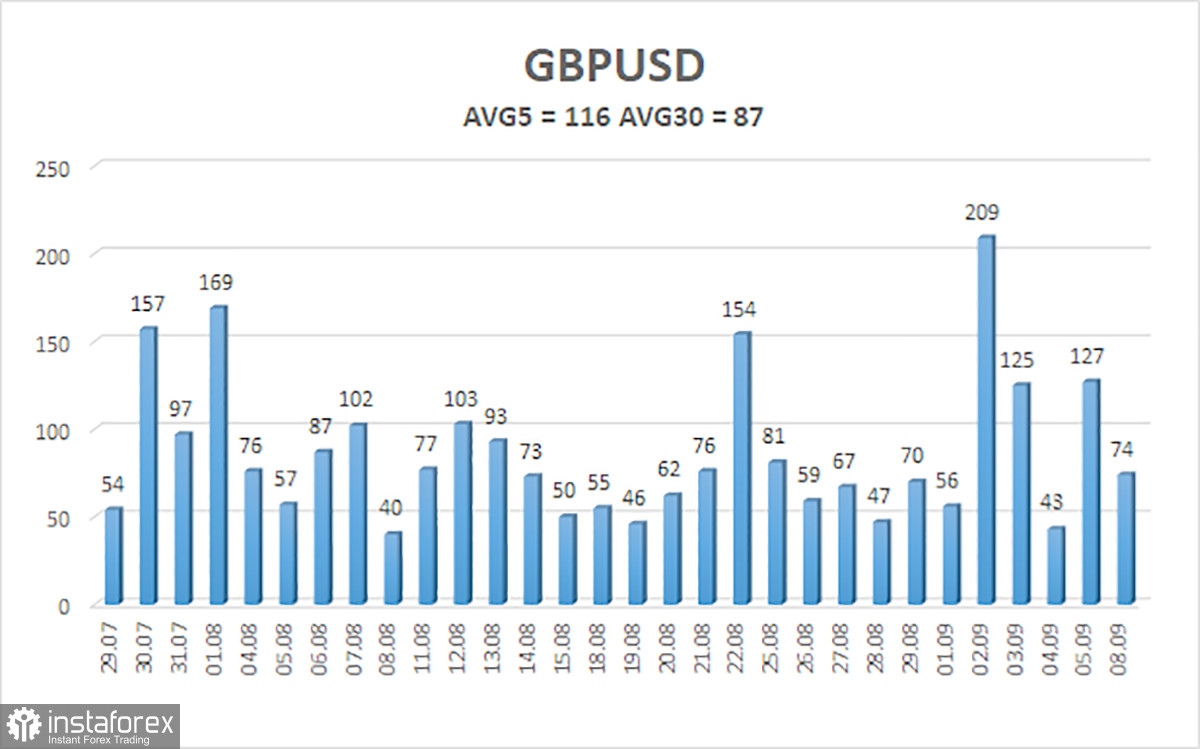
The average volatility for GBP/USD over the last five trading days is 116 pips. For the pound/dollar pair, this is considered "high." On Tuesday, September 9, we expect movement within the range bounded by levels 1.3428 and 1.3660. The upper channel of linear regression is pointing upwards, which clearly indicates an upward trend. The CCI indicator once again entered the oversold area, further warning about the resumption of the uptrend.
Nearest Support Levels:
S1 – 1.3489
S2 – 1.3428
S3 – 1.3367
Nearest Resistance Levels:
R1 – 1.3550
R2 – 1.3611
R3 – 1.3672
Trading Recommendations:
The GBP/USD currency pair is again aiming to resume its uptrend. In the medium term, Trump's policies are likely to continue putting pressure on the dollar, so we do not expect the dollar to rise. Therefore, long positions with targets at 1.3611 and 1.3672 remain much more relevant while the price is above the moving average. If the price slips below the moving average, small shorts can be considered on strictly technical grounds. From time to time, the US currency does show corrections, but for a sustainable trend reversal, it needs real signs of an end to the global trade war or some other major positive factors.
Chart Elements Explained:
- Linear regression channels help determine the current trend. If both channels point in the same direction, the trend is strong.
- The moving average line (settings 20,0, smoothed) indicates the short-term trend and trade direction.
- Murray levels serve as target levels for moves and corrections.
- Volatility levels (red lines) are the likely price channel for the next day, based on current volatility readings.
- The CCI indicator: dips below -250 (oversold) or rises above +250 (overbought) mean a trend reversal may be near.