Analysis of Friday's Trades
1H Chart of GBP/USD
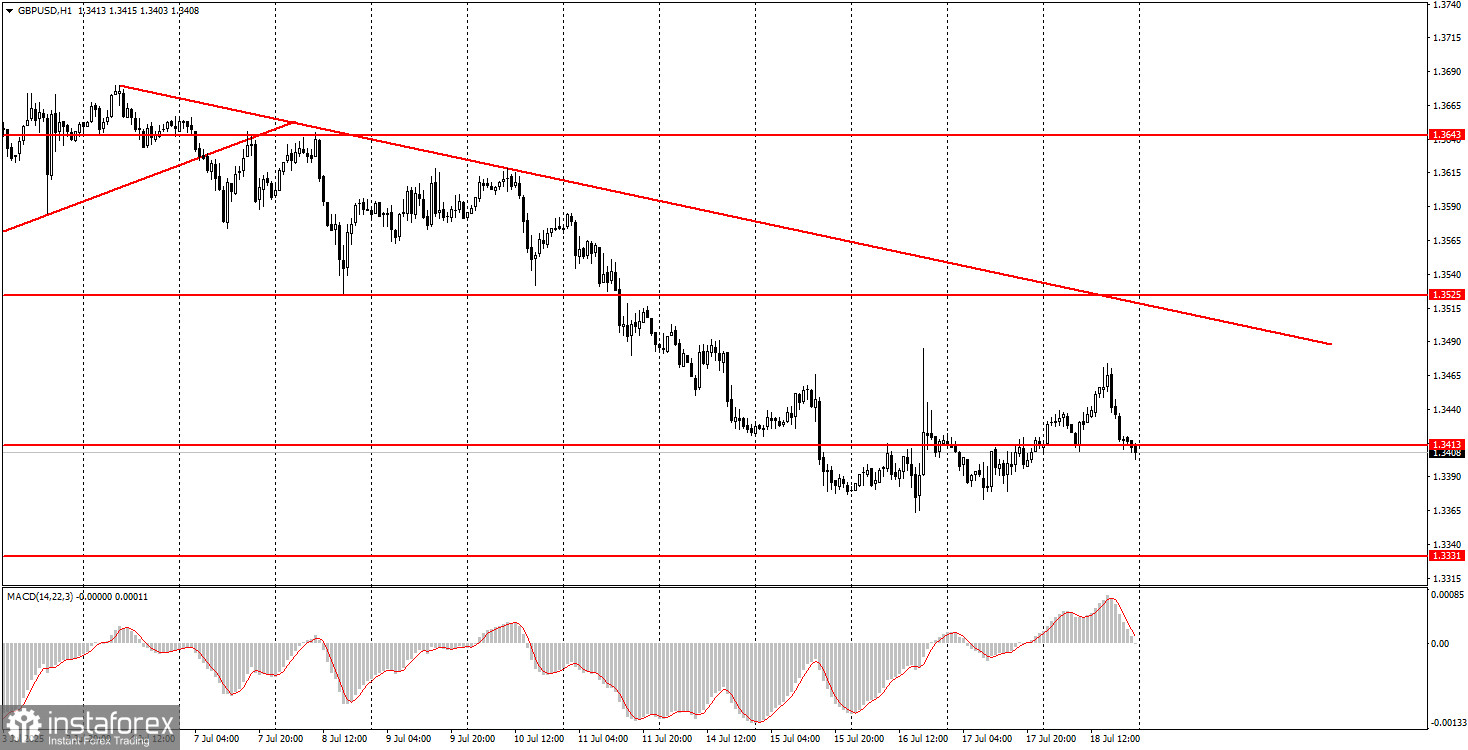
The GBP/USD pair also traded higher on Friday, but this movement had little meaningful impact. The downtrend in the British pound remains in place, and the market continues to interpret many macroeconomic and fundamental events in its ambiguous way. Therefore, we believe that more focus should be placed on the technical aspects at this time.
There have been few fundamental factors supporting the dollar's rise over the past three weeks. However, it is essential to remember that the U.S. dollar is not the currency of a "third-world country." It had been declining for five straight months after rising for 16 years. Even its current growth is merely a minor correction, which is visible on the daily timeframe. If even such corrections were absent, then what would market movement look like?
Thus, we are now observing price action that completely contradicts the fundamental backdrop. For the dollar to decline, only two factors are needed: Trump's war with the Federal Reserve and his trade war with half the world. We believe that all the currently "ignored" news will eventually be priced in once this correction is over.
5M Chart of GBP/USD
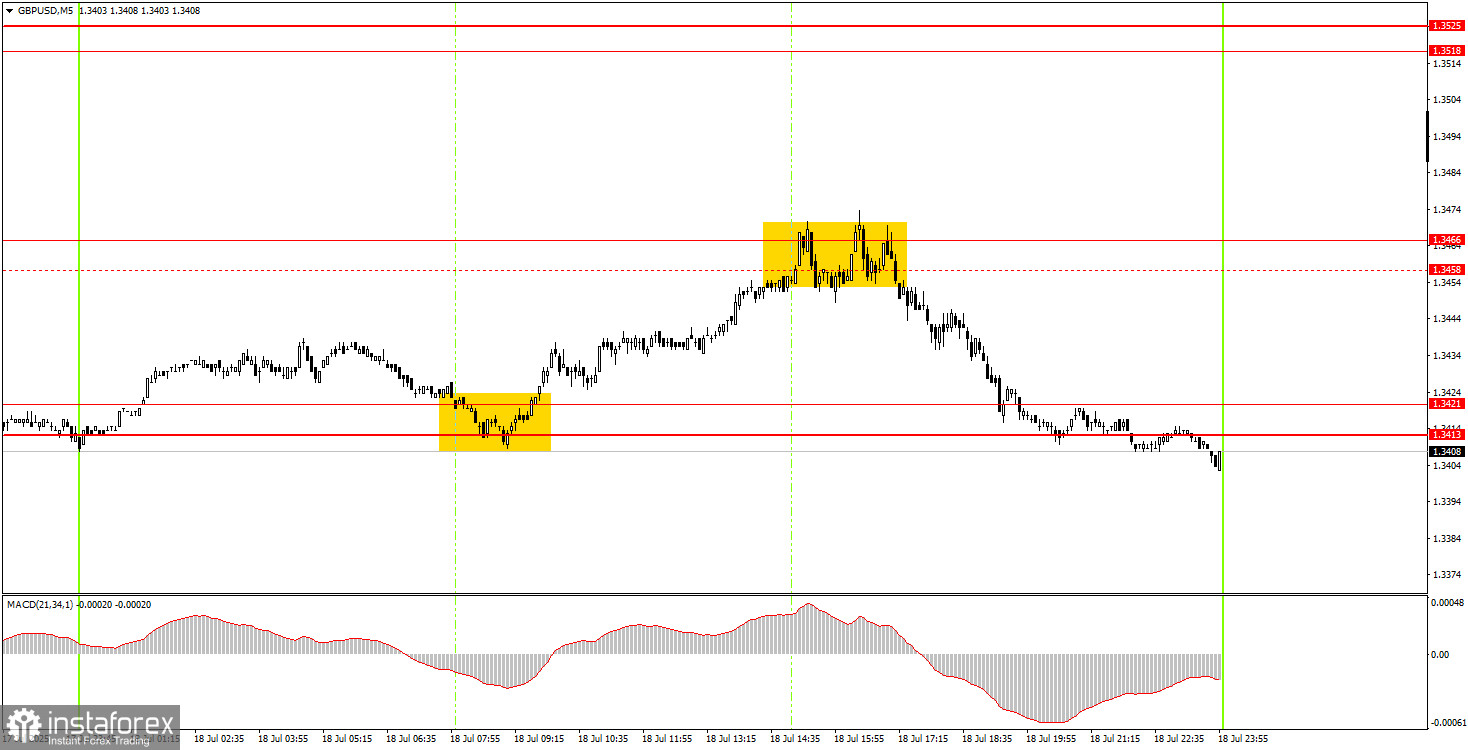
On the 5-minute timeframe, two trading signals were formed on Friday. First, the pair bounced off the 1.3413–1.3421 area with near-perfect accuracy and then rose to the 1.3458 level during the U.S. session. By the end of the day, we adjusted this level to 1.3466. In any case, the upward move ended near this level, and once the price consolidated below it, novice traders could consider opening short positions. By the end of the day, the pair returned to the 1.3413–1.3421 zone.
Trading Strategy for Monday:
On the hourly timeframe, the GBP/USD pair continues to maintain a downward trend. We believe the current decline is purely a technical correction, as there are still no fundamental reasons for the dollar's rise. Nonetheless, the market may continue trading based on technical factors, which is what we are seeing now. Until the price breaks above the trendline, there are no technical grounds for resuming the six-month uptrend.
On Monday, GBP/USD may resume its decline, but there are no strong drivers for either upward or downward movement on the first trading day of the week—unless, of course, Trump announces new tariffs or "fires Powell" for the twentieth time.
On the 5-minute timeframe, trading can be based on the following levels: 1.3203–1.3211, 1.3259, 1.3329–1.3331, 1.3413–1.3421, 1.3466, 1.3518–1.3525, 1.3574–1.3590, 1.3643–1.3652, 1.3682, 1.3763, 1.3814–1.3832.
There are no noteworthy events in Monday's economic calendar.
Core Trading System Rules:
- Signal Strength: The shorter the time it takes for a signal to form (a rebound or breakout), the stronger the signal.
- False Signals: If two or more trades near a level result in false signals, subsequent signals from that level should be ignored.
- Flat Markets: In flat conditions, pairs may generate many false signals or none at all. It's better to stop trading at the first signs of a flat market.
- Trading Hours: Open trades between the start of the European session and the middle of the US session, then manually close all trades.
- MACD Signals: On the hourly timeframe, trade MACD signals only during periods of good volatility and a clear trend confirmed by trendlines or trend channels.
- Close Levels: If two levels are too close (5–20 pips apart), treat them as a support or resistance zone.
- Stop Loss: Set a Stop Loss to breakeven after the price moves 20 pips in the desired direction.
Key Chart Elements:
Support and Resistance Levels: These are target levels for opening or closing positions and can also serve as points for placing Take Profit orders.
Red Lines: Channels or trendlines indicating the current trend and the preferred direction for trading.
MACD Indicator (14,22,3): A histogram and signal line used as a supplementary source of trading signals.
Important Events and Reports: Found in the economic calendar, these can heavily influence price movements. Exercise caution or exit the market during their release to avoid sharp reversals.
Forex trading beginners should remember that not every trade will be profitable. Developing a clear strategy and practicing proper money management are essential for long-term trading success.